Category5Kaiju wrote:Many of these models (CanSIPS especially) are predicting a wetter than average Bahamas and Florida
If you don't mind can you post some of these models?
Moderator: S2k Moderators


Category5Kaiju wrote:Many of these models (CanSIPS especially) are predicting a wetter than average Bahamas and Florida


SFLcane wrote:Category5Kaiju wrote:Many of these models (CanSIPS especially) are predicting a wetter than average Bahamas and Florida
If you don't mind can you post some of these models?
Category5Kaiju wrote:SFLcane wrote:Category5Kaiju wrote:Many of these models (CanSIPS especially) are predicting a wetter than average Bahamas and Florida
If you don't mind can you post some of these models?
https://www.tropicaltidbits.com/analysi ... 50200&fh=5
Here's the ASO precip anomaly from CFV2 (latest run; there have been some fluctuations over some of the past runs but in general the region near Florida and the Bahamas have typically been the wettest)


Shell Mound wrote:Category5Kaiju wrote:SFLcane wrote:
If you don't mind can you post some of these models?
https://www.tropicaltidbits.com/analysi ... 50200&fh=5
Here's the ASO precip anomaly from CFV2 (latest run; there have been some fluctuations over some of the past runs but in general the region near Florida and the Bahamas have typically been the wettest)
Actually, the past ten CanSIPS runs have been showing a lot of systems curving east of FL and/or north of the Leeward Islands and thence OTS. The CONUS is “dry.”

Shell Mound wrote:Kingarabian wrote:While anything is possible this year, I'm not so sure Modoki La Nina is in the cards yet. It's not even present and other than what some of these models are showing, currently there's nothing to support such a development. The Nino 4 and Nino 3.4 regions are currently much warmer than the Nino 3 and Nino 1+2 regions. In Modoki La Nina's, Nino 4 and Nino 3.4 are much cooler than Nino 3 and Nino 1+2.
The April ECMWF plume for Niño 1+2 seems to have verified considerably better than the March forecast, and it shows significant warming during MJJ, with a west-based Niña evolving by ASO. The CanSIPS shows this general evolution as well, likely due to CCKW activity + active MJO + subsurface warming. So I think there is a good chance that the warm anomalies in Niño 4+3.4 will subside over the coming months, while westerly wind anomalies focused over the eastern Niño zones will result in considerable warming there, especially relative to the western zones. This will end up reinforcing the “Modoki”-type Niña signature, given MJO-modulated periods of enhanced trades will tend to concentrate near the IDL. This will, in my view, end up being at least somewhat detrimental to Atlantic TC activity, particularly ACE, and also result in a less conducive steering regime to landfalls. We shall see.

Category5Kaiju wrote:What I am curious about though is how precisely these precip anomalies can predict storm tracks this far in advance and how well correlated they are. I am not sure where to go for this, but I would love to see a map of what these precip anomalies looked like in May for years like 2017 and 2010 and see how well they verified after the season was done.
Also I would like to point out that while it's understandable that many folks tend to worry about US impacts as that is where they live, I don't think at this point in time there is any reliable way of knowing if this season could turn out to be one of those seasons where the US is spared from major landfalling impacts but countries like the Bahamas or Dominican Republic aren't due to the hurricane activity being concentrated more to the east. Or what about that one storm that happens to get "lucky" and get trapped under a ridge of high pressure and be able to traverse the warm Strait of Florida while the many storms behind it go on off to sea? I think there are many possibilities that still warrant preparation and consideration, and in my humble opinion just because the precip anomalies maps in May point toward a dry Caribbean or OTS storm tracks does not necessarily mean that is a done deal and that every Atlantic coast resident should brush things off and think another 2010 is going to happen.
Category5Kaiju wrote:What I am curious about though is how precisely these precip anomalies can predict storm tracks this far in advance and how well correlated they are. I am not sure where to go for this, but I would love to see a map of what these precip anomalies looked like in May for years like 2017 and 2010 and see how well they verified after the season was done.
AutoPenalti wrote:canSIPS should not be used for forecasting tracks.
JetFuel_SE wrote:Pretty sure that stuff doesn't predict storm tracks at all lmao.
Shell Mound wrote:Category5Kaiju wrote:What I am curious about though is how precisely these precip anomalies can predict storm tracks this far in advance and how well correlated they are. I am not sure where to go for this, but I would love to see a map of what these precip anomalies looked like in May for years like 2017 and 2010 and see how well they verified after the season was done.
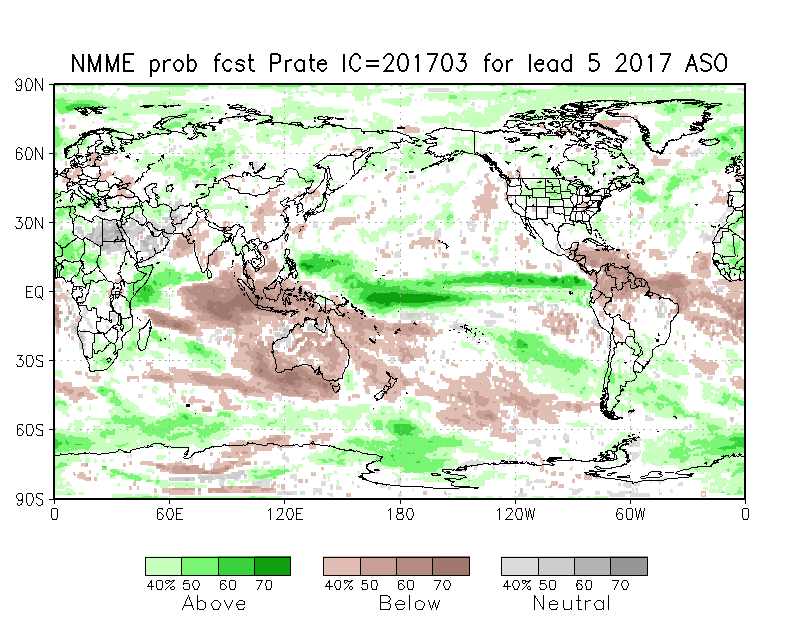
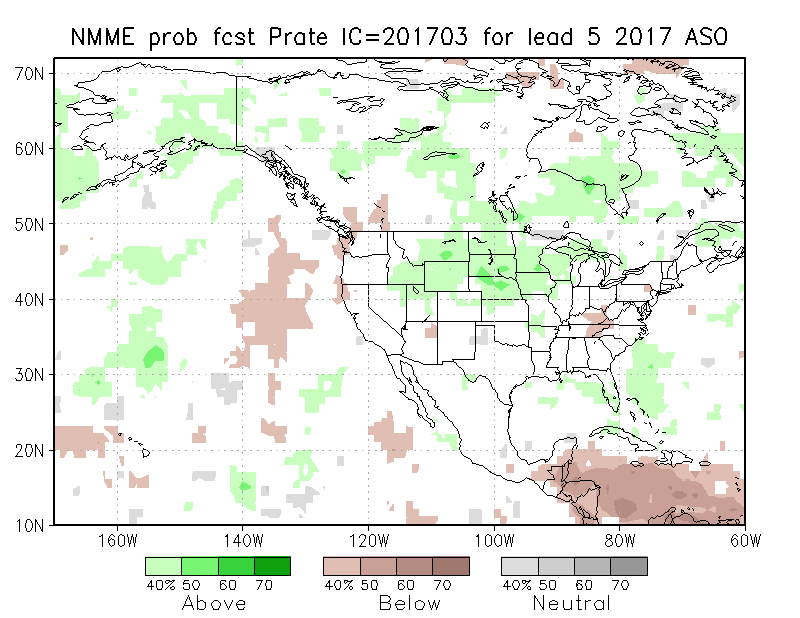
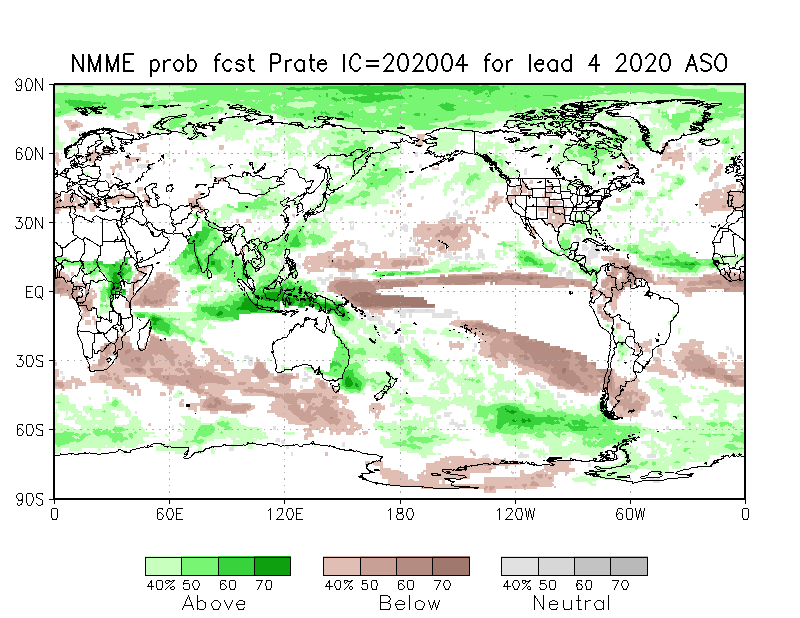
Yes, these long-range forecasts have proven to be quite accurate in the recent past, given their scope (the NMME includes CanSIPS):
https://pbs.twimg.com/media/EwD3rayXYAI6PKz?format=png&name=900x900
https://www.cpc.ncep.noaa.gov/products/NMME/archive/2017030800/prob/images/prob_ensemble_prate_us_season5.png
https://pbs.twimg.com/media/EydMEE1WEAUwLpc?format=png&name=900x900
https://pbs.twimg.com/media/EoDu--1VkAE9wFh?format=jpg&name=large
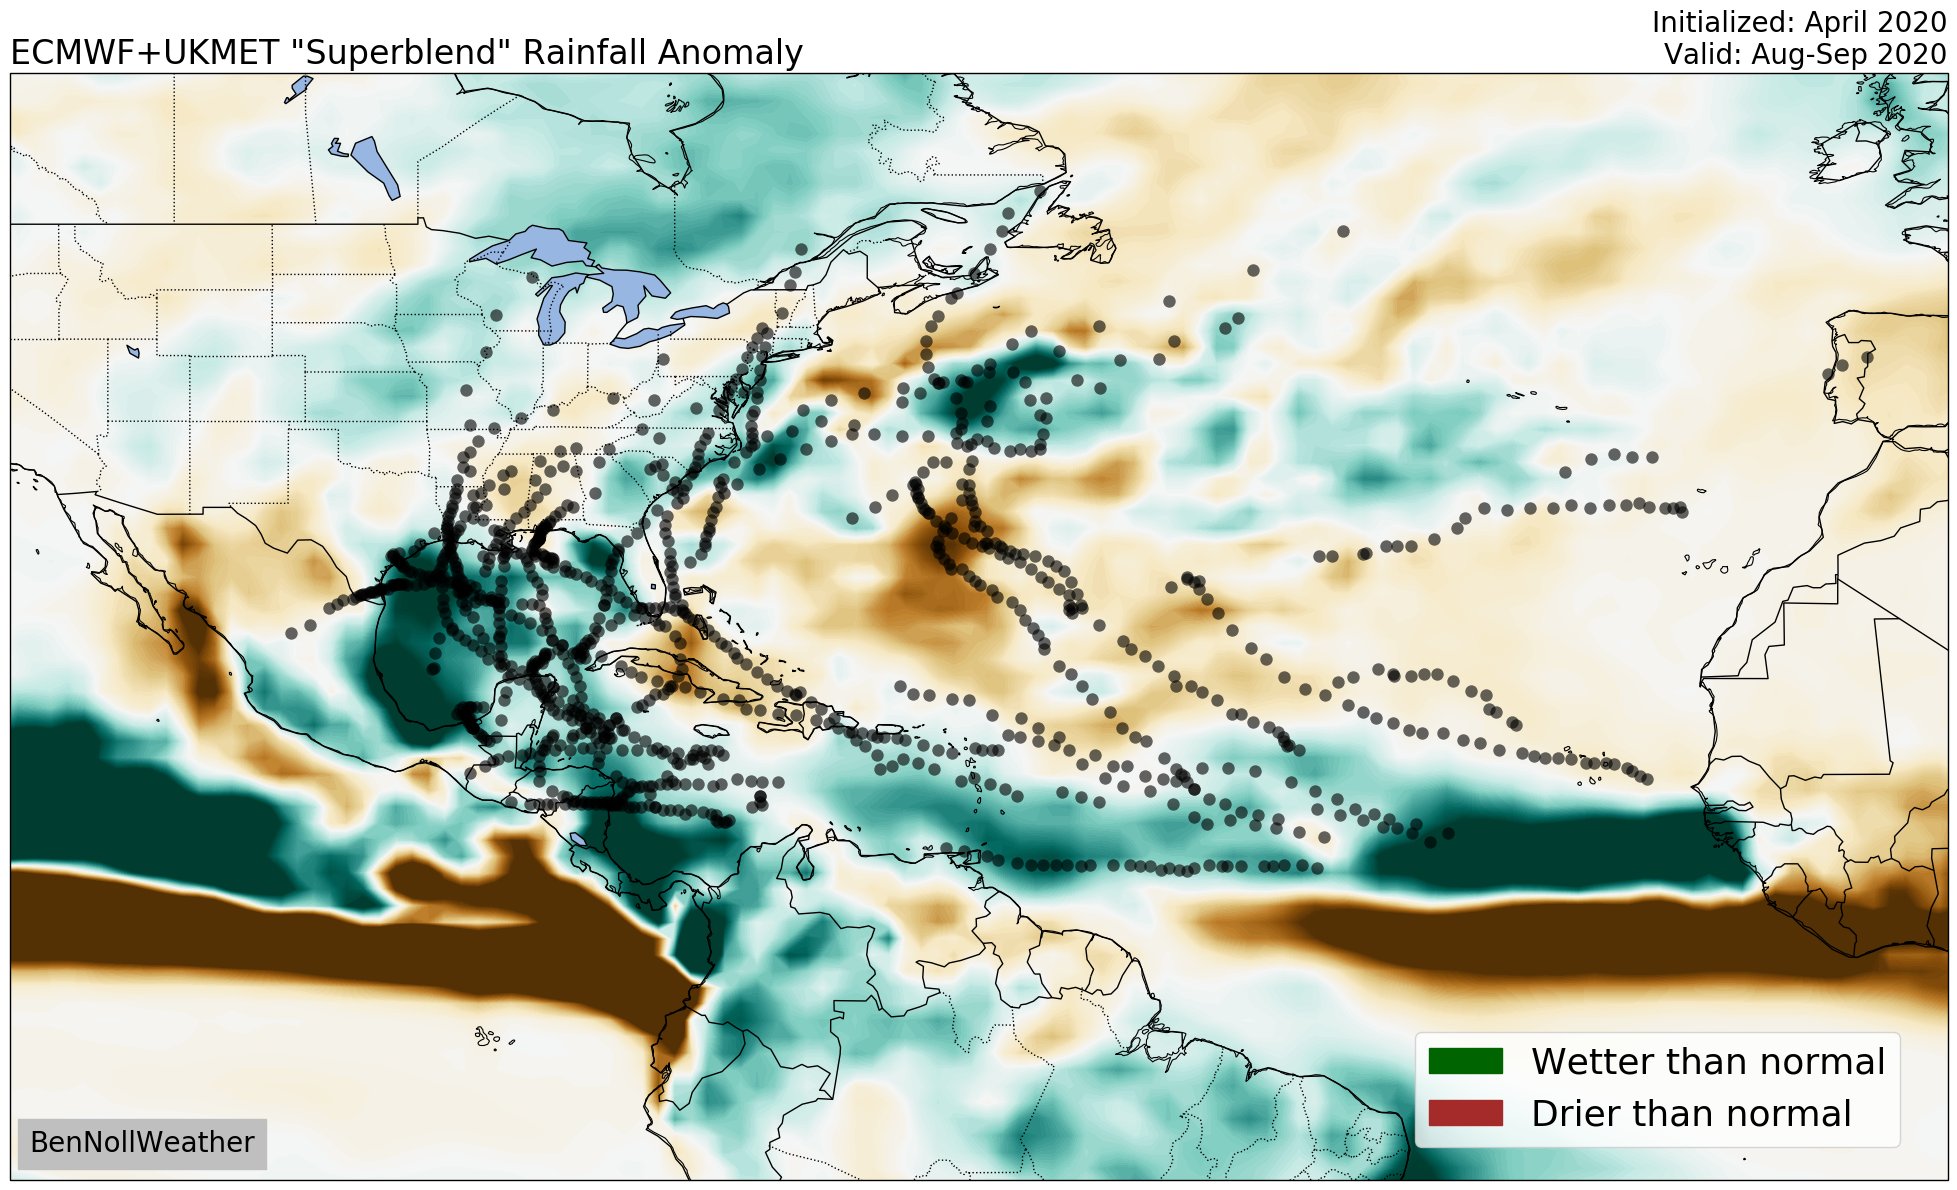
https://twitter.com/BenNollWeather/status/1333425301158694912AutoPenalti wrote:canSIPS should not be used for forecasting tracks.JetFuel_SE wrote:Pretty sure that stuff doesn't predict storm tracks at all lmao.
I respectfully disagree. The above prove that these models can be used to form a general idea, even in the long range.
Category5Kaiju wrote:Shell Mound wrote:Category5Kaiju wrote:What I am curious about though is how precisely these precip anomalies can predict storm tracks this far in advance and how well correlated they are. I am not sure where to go for this, but I would love to see a map of what these precip anomalies looked like in May for years like 2017 and 2010 and see how well they verified after the season was done.
Yes, these long-range forecasts have proven to be quite accurate in the recent past, given their scope (the NMME includes CanSIPS):
https://pbs.twimg.com/media/EwD3rayXYAI6PKz?format=png&name=900x900
https://www.cpc.ncep.noaa.gov/products/NMME/archive/2017030800/prob/images/prob_ensemble_prate_us_season5.png
https://pbs.twimg.com/media/EydMEE1WEAUwLpc?format=png&name=900x900
https://pbs.twimg.com/media/EoDu--1VkAE9wFh?format=jpg&name=large
https://twitter.com/BenNollWeather/status/1333425301158694912AutoPenalti wrote:canSIPS should not be used for forecasting tracks.JetFuel_SE wrote:Pretty sure that stuff doesn't predict storm tracks at all lmao.
I respectfully disagree. The above prove that these models can be used to form a general idea, even in the long range.
Hmm ok, interesting to know. I would like to point out though at least that last year there seems to be a cluster of storm tracks (including Teddy’s) that occurred in a predicted dry zone while in the 2017 map Category 5 Maria occurred in the Far East Caribbean, which was also a predicted dry zone. So while I guess based on what you have shown there seems to be a correlation, I am not exactly sure how perfect it is as it seems like you can still get powerful storms in the brown regions. However, I still think you make a very interesting and good argument about what you think will occur this season.
Here's another interesting tweet I found regarding possible precip anomalies this season:
https://twitter.com/Souza101Matt/status/1388989879346946049


SFLcane wrote:Just a few weeks away from potential development across the Atlantic.
https://twitter.com/bennollweather/status/1389588877162254339

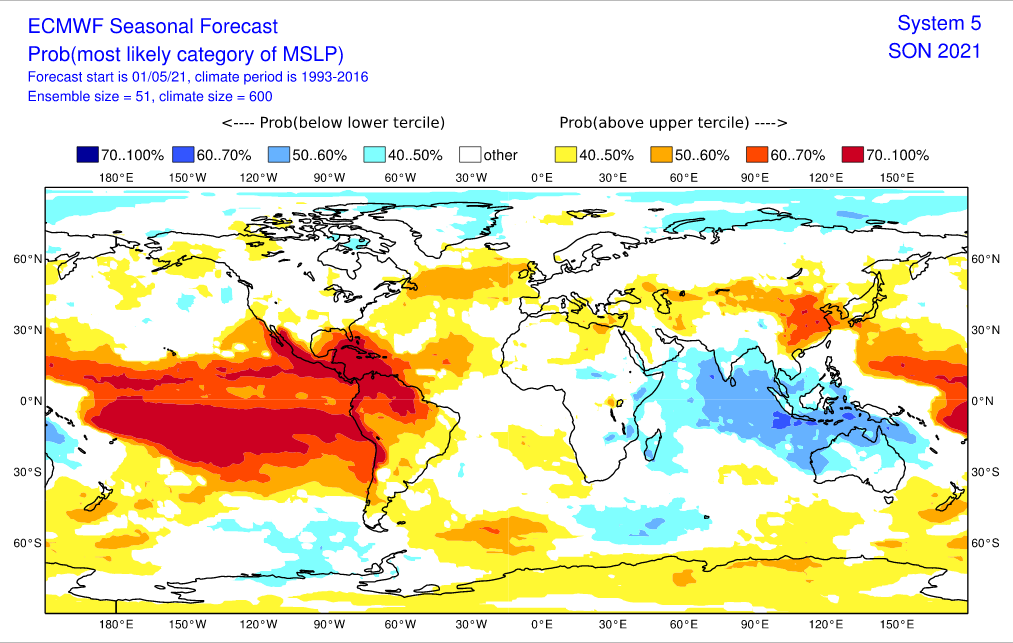
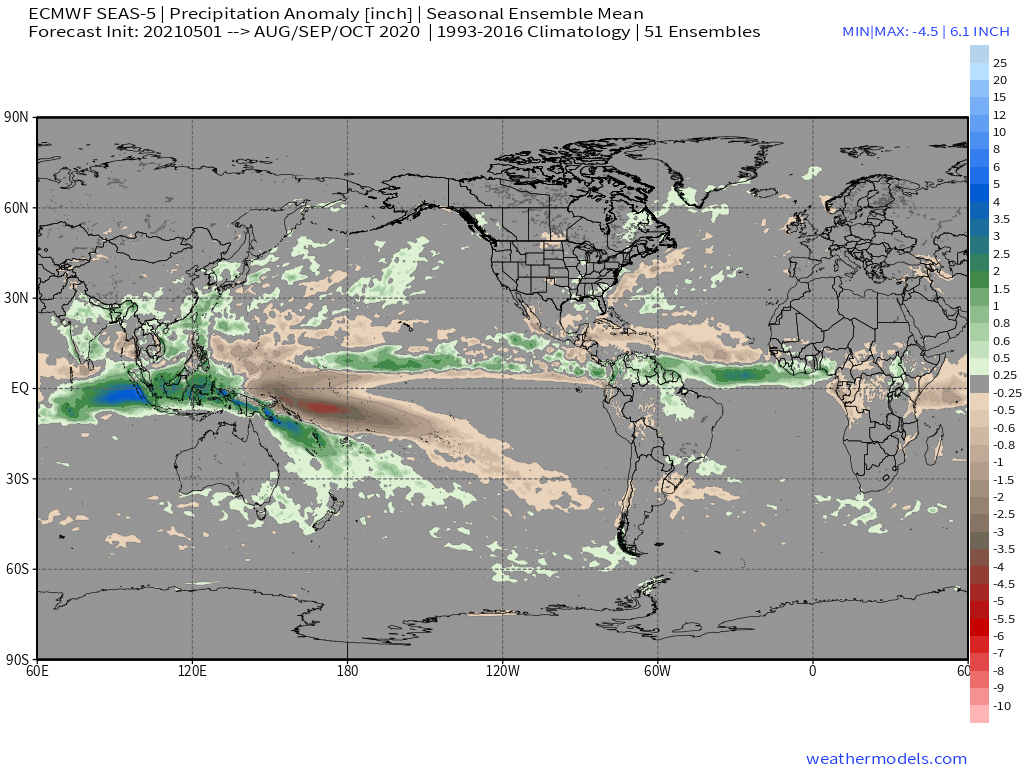
Kingarabian wrote:May Euro seasonal:
MSLP for September:
https://i.postimg.cc/ncvHzz4L/image.png
ASO rainfall:
https://i.postimg.cc/xTHdzg2n/image.png

Iceresistance wrote:Kingarabian wrote:May Euro seasonal:
MSLP for September:
https://i.postimg.cc/ncvHzz4L/image.png
ASO rainfall:
https://i.postimg.cc/xTHdzg2n/image.png
The Euro wants a full-blown El Niño by September . . .
Users browsing this forum: No registered users and 213 guests