


Data from NOAA - ftp://ftp.star.nesdis.noaa.gov/pub/sod/ ... 1.0/daily/
Moderator: S2k Moderators


Shell Mound wrote:
Last year’s forecast for JAS:
https://pbs.twimg.com/media/EV6B-aCXQAcqkH9?format=png&name=900x900
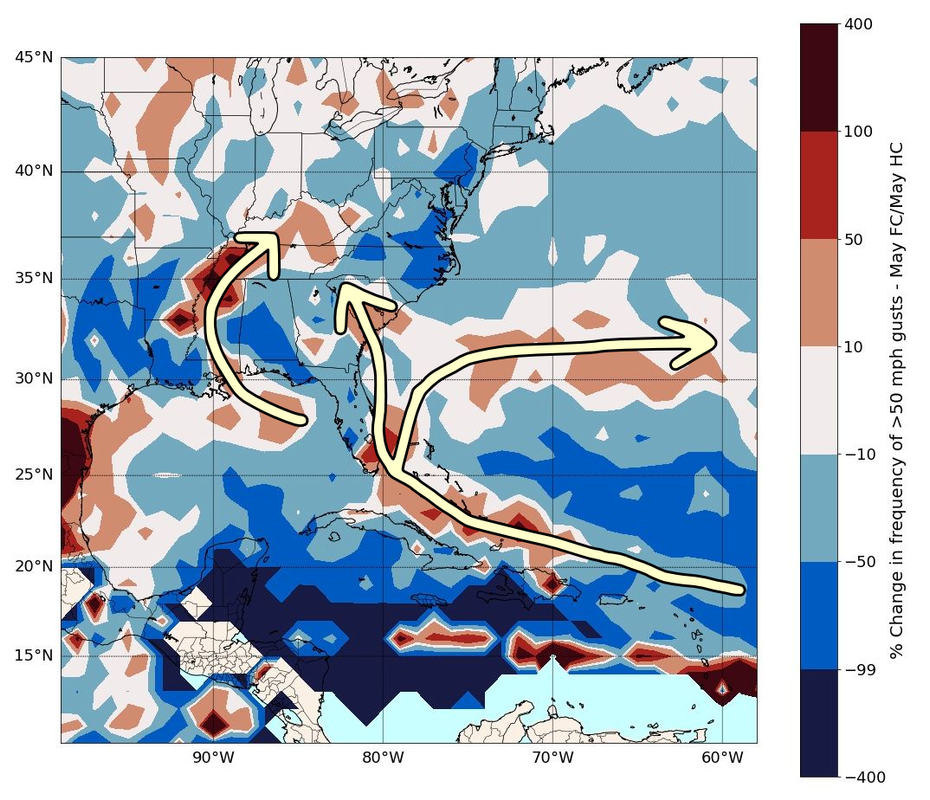
This year’s forecast for ASO:
https://pbs.twimg.com/media/E1imza2XoAAIFjc?format=jpg&name=medium

Blown Away wrote:Shell Mound wrote:
Last year’s forecast for JAS:
https://pbs.twimg.com/media/EV6B-aCXQAcqkH9?format=png&name=900x900
This year’s forecast for ASO:
https://pbs.twimg.com/media/E1imza2XoAAIFjc?format=jpg&name=medium
If that 2020 graphic was posted April 2020, amazingly accurate. The 2021 graphic suggests general track for storms through or just N of Caribbean and then begin that recurve as they near Florida.
SFLcane wrote:Blown Away wrote:Shell Mound wrote:Last year’s forecast for JAS:
https://pbs.twimg.com/media/EV6B-aCXQAcqkH9?format=png&name=900x900
This year’s forecast for ASO:
https://pbs.twimg.com/media/E1imza2XoAAIFjc?format=jpg&name=medium
If that 2020 graphic was posted April 2020, amazingly accurate. The 2021 graphic suggests general track for storms through or just N of Caribbean and then begin that recurve as they near Florida.
Take with a grain of salt but that 50kt signature is draped across SFL.
Shell Mound wrote:SFLcane wrote:Blown Away wrote:
If that 2020 graphic was posted April 2020, amazingly accurate. The 2021 graphic suggests general track for storms through or just N of Caribbean and then begin that recurve as they near Florida.
Take with a grain of salt but that 50kt signature is draped across SFL.
https://i.postimg.cc/X76hFcwc/2021-ECsetup-1.png
The contours actually suggest a mean track over the Gulf Stream, between South Florida and Grand Bahama, en route either to South Carolina or OTS.
https://twitter.com/Nichola76551479/status/1394318989195583490

SFLcane wrote:Look at forecast for GOM last season. No much else to be said. Drop mic
https://twitter.com/catinsight/status/1251581242262401024
Nuno wrote:Shell Mound wrote:SFLcane wrote:
Take with a grain of salt but that 50kt signature is draped across SFL.
https://i.postimg.cc/X76hFcwc/2021-ECsetup-1.png
The contours actually suggest a mean track over the Gulf Stream, between South Florida and Grand Bahama, en route either to South Carolina or OTS.
https://twitter.com/Nichola76551479/status/1394318989195583490
Or it could be just a SFL strike :p you don't need to try and refute everything. Products like this are just fun to look at, it honestly is impossible to determine what areas will be most targeted and even our most useful products cannot determine such.
Shell Mound wrote:SFLcane wrote:Blown Away wrote:
If that 2020 graphic was posted April 2020, amazingly accurate. The 2021 graphic suggests general track for storms through or just N of Caribbean and then begin that recurve as they near Florida.
Take with a grain of salt but that 50kt signature is draped across SFL.
https://i.postimg.cc/X76hFcwc/2021-ECsetup-1.png
The contours actually suggest a mean track over the Gulf Stream, between South Florida and Grand Bahama, en route either to South Carolina or OTS.
https://twitter.com/Nichola76551479/status/1394318989195583490

AutoPenalti wrote:Shell Mound wrote:SFLcane wrote:
Take with a grain of salt but that 50kt signature is draped across SFL.
https://i.postimg.cc/X76hFcwc/2021-ECsetup-1.png
The contours actually suggest a mean track over the Gulf Stream, between South Florida and Grand Bahama, en route either to South Carolina or OTS.
https://twitter.com/Nichola76551479/status/1394318989195583490
Again, forecasting a track like that months in advance is fools gold.


Shell Mound wrote:SFLcane wrote:Blown Away wrote:
If that 2020 graphic was posted April 2020, amazingly accurate. The 2021 graphic suggests general track for storms through or just N of Caribbean and then begin that recurve as they near Florida.
Take with a grain of salt but that 50kt signature is draped across SFL.
https://i.postimg.cc/X76hFcwc/2021-ECsetup-1.png
The contours actually suggest a mean track over the Gulf Stream, between South Florida and Grand Bahama, en route either to South Carolina or OTS.
https://twitter.com/Nichola76551479/status/1394318989195583490

Shell Mound wrote:[list of tweets, primarily from Andy Hazelton]
At this rate CSU et al. will need to reduce their numbers substantially. This SST profile + African monsoon supports 2018-type numbers/indices at best.
NXStumpy_Robothing wrote:Shell Mound wrote:[list of tweets, primarily from Andy Hazelton]
At this rate CSU et al. will need to reduce their numbers substantially. This SST profile + African monsoon supports 2018-type numbers/indices at best.
If SST patterns in May were the only thing that served as an indication of how active a season could be, I'd be inclined to at least partially agree. However, as noted in that series of twitter threads, the MDR is still warmer than both 2018 and 2019, just not anomalously warm like the rest of the North Atlantic is. Combined with all of the other favorable predicted factors, such as the predicted cool-neutral to weak La Nina, reduced shear, active wave train, and the semi-favorable steering pattern for longer-tracked systems, I don't really see a need for the CSU to come out with much of a reduction in their numbers unless we see some other indicators begin to switch towards a less favorable outcome for TC activity.
As a side note: even if the season turned out to be like 2018 or 2019, it's worth noting that those two seasons produced a record-setting TC-caused flooding event in both the Carolinas (Florence) and southeast Texas (Imelda), the first Category 5 storm to hit the United States at that intensity in over 25 years (Michael), one of the strongest hurricanes ever recorded by windspeed in the North Atlantic that devastated the Bahamas (Dorian), the easternmost Category 5 on record (Lorenzo), and another major hurricane that slammed Bermuda (Humberto). Just because a season may be less active than literally the most active season on record in 2020 does not mean there aren't serious effects for us here or off of the North American coastline, or even the Azores (Lorenzo again).
With that said, the current SST profile does support some mild convective suppression over the MDR, but it also likely means that a) we'll see a noticeable uptick in activity in the subtropics and b) we'll see waves struggle to develop in the MDR, move into the Eastern Caribbean/southeast Atlantic, and develop there instead. While this would probably reduce the chance for Gulf of Mexico activity to a degree, the fact that the current and forecasted conditions mean that waves will likely be developing closer to land is a serious cause for concern regardless. As for analogs, I've seen 1999 thrown around a few times on Twitter, and I think this is a decent analog. Other analogs I'd probably consider are 2011, 2012, and the aforementioned duo of 2018 and 2019. If conditions change, I could see something like 2010 (better conditions, allowing waves to develop earlier) or 2015 (worse conditions, preventing much of any development outside of the subtropics) being possible.


Shell Mound wrote:At this rate CSU et al. will need to reduce their numbers substantially. This SST profile + African monsoon supports 2018-type numbers/indices at best.
NotSparta wrote:Shell Mound wrote:At this rate CSU et al. will need to reduce their numbers substantially. This SST profile + African monsoon supports 2018-type numbers/indices at best.
Just because the SSTs aren't as warm as 2020 shouldn't be a reason to cap a forecast that low, especially when there is no +ENSO like in 2018
Users browsing this forum: No registered users and 257 guests
