2021 Indicators: SST's / SAL / MSLP / Shear / Steering / Instability / Sat Images

This is the general tropical discussion area. Anyone can take their shot at predicting a storms path.

Moderator: S2k Moderators

Forum rules

The posts in this forum are NOT official forecasts and should not be used as such. They are just the opinion of the poster and may or may not be backed by sound meteorological data. They are NOT endorsed by any professional institution or STORM2K. For official information, please refer to products from the National Hurricane Center and National Weather Service.

Help Support Storm2K
Message
Author
USTropics
Professional-Met
Professional-Met
Posts: 2650
Joined: Sun Aug 12, 2007 3:45 am
Location: Florida State University

Re: 2021 Indicators: SST's / SAL / MSLP / Shear / Steering / Instability / Sat Images

#481 Postby USTropics » Sun May 16, 2021 10:49 pm

Here are some high-res products I'm working on (very large images). First 3 images are from May 15th 2021 (sea surface temperatures, sea surface anomalies, 7-day SST trend). Last image is from May 15th 1999.
Image

Image

Image

Image

Data from NOAA - ftp://ftp.star.nesdis.noaa.gov/pub/sod/ ... 1.0/daily/
Last edited by USTropics on Sun May 16, 2021 10:56 pm, edited 1 time in total.
6 likes   

AutoPenalti
Category 5
Category 5
Posts: 4030
Age: 29
Joined: Mon Aug 17, 2015 4:16 pm
Location: Ft. Lauderdale, Florida

Re: 2021 Indicators: SST's / SAL / MSLP / Shear / Steering / Instability / Sat Images

#482 Postby AutoPenalti » Sun May 16, 2021 10:55 pm

SFLcane wrote:Um holy cow South Florida! :eek:

https://twitter.com/catinsight/status/1394048135610224645

Doesn’t really mean much in the grand scheme of things. It’s very hard to predict any Florida landfall so far out in time. The resolution seems odd as well. SST signature does look interesting and not really liking the set-up.
1 likes   
The posts in this forum are NOT official forecasts and should not be used as such. They are just the opinion of the poster and may or may not be backed by sound meteorological data. They are NOT endorsed by any professional institution or STORM2K. For official information, please refer to products from the NHC and NWS.


Model Runs Cheat Sheet:
GFS (5:30 AM/PM, 11:30 AM/PM)
HWRF, GFDL, UKMET, NAVGEM (6:30-8:00 AM/PM, 12:30-2:00 AM/PM)
ECMWF (1:45 AM/PM)

TCVN
is a weighted averaged

Shell Mound
Category 5
Category 5
Posts: 2434
Age: 32
Joined: Thu Sep 07, 2017 3:39 pm
Location: St. Petersburg, FL → Scandinavia

Re: 2021 Indicators: SST's / SAL / MSLP / Shear / Steering / Instability / Sat Images

#483 Postby Shell Mound » Mon May 17, 2021 3:46 am

SFLcane wrote:Um holy cow South Florida! :eek:

https://twitter.com/catinsight/status/1394048135610224645

Last year’s forecast for JAS:
Image

This year’s forecast for ASO:
Image
2 likes   
CVW / MiamiensisWx / Shell Mound
The posts in this forum are NOT official forecasts and should not be used as such. They are just the opinion of the poster and may or may not be backed by sound meteorological data. They are NOT endorsed by any professional institution or STORM2K. For official information, please refer to products from the NHC and NWS.

User avatar
Blown Away
S2K Supporter
S2K Supporter
Posts: 10145
Joined: Wed May 26, 2004 6:17 am

Re: 2021 Indicators: SST's / SAL / MSLP / Shear / Steering / Instability / Sat Images

#484 Postby Blown Away » Mon May 17, 2021 8:28 am


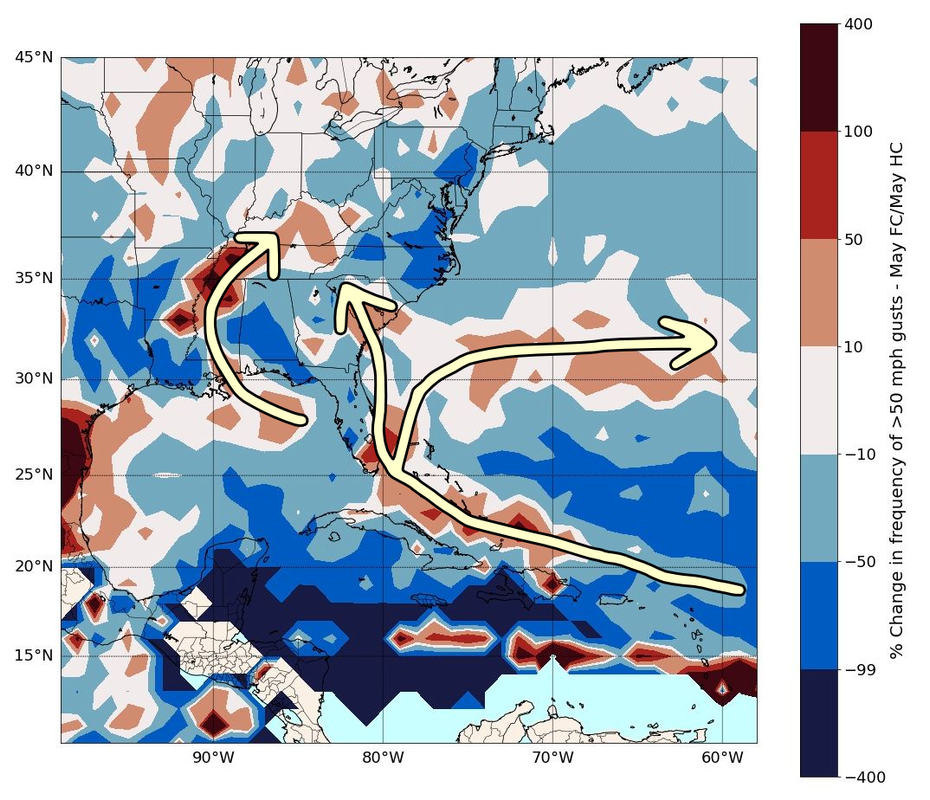
If that 2020 graphic was posted April 2020, amazingly accurate. The 2021 graphic suggests general track for storms through or just N of Caribbean and then begin that recurve as they near Florida.
1 likes   
Hurricane Eye Experience: David 79, Irene 99, Frances 04, Jeanne 04, Wilma 05... EYE COMING MY WAY IN 2024…
Hurricane Brush Experience: Andrew 92, Erin 95, Floyd 99, Matthew 16, Irma 17, Ian 22, Nicole 22…

User avatar
SFLcane
S2K Supporter
S2K Supporter
Posts: 10163
Age: 47
Joined: Sat Jun 05, 2010 1:44 pm
Location: Lake Worth Florida

Re: 2021 Indicators: SST's / SAL / MSLP / Shear / Steering / Instability / Sat Images

#485 Postby SFLcane » Mon May 17, 2021 8:30 am

Blown Away wrote:


If that 2020 graphic was posted April 2020, amazingly accurate. The 2021 graphic suggests general track for storms through or just N of Caribbean and then begin that recurve as they near Florida.


Take with a grain of salt but that 50kt signature is draped across SFL.
0 likes   

User avatar
SFLcane
S2K Supporter
S2K Supporter
Posts: 10163
Age: 47
Joined: Sat Jun 05, 2010 1:44 pm
Location: Lake Worth Florida

Re: 2021 Indicators: SST's / SAL / MSLP / Shear / Steering / Instability / Sat Images

#486 Postby SFLcane » Mon May 17, 2021 9:50 am

0 likes   

Shell Mound
Category 5
Category 5
Posts: 2434
Age: 32
Joined: Thu Sep 07, 2017 3:39 pm
Location: St. Petersburg, FL → Scandinavia

Re: 2021 Indicators: SST's / SAL / MSLP / Shear / Steering / Instability / Sat Images

#487 Postby Shell Mound » Mon May 17, 2021 12:11 pm

SFLcane wrote:
Blown Away wrote:


If that 2020 graphic was posted April 2020, amazingly accurate. The 2021 graphic suggests general track for storms through or just N of Caribbean and then begin that recurve as they near Florida.


Take with a grain of salt but that 50kt signature is draped across SFL.

Image
The contours actually suggest a mean track over the Gulf Stream, between South Florida and Grand Bahama, en route either to South Carolina or OTS.
 https://twitter.com/Nichola76551479/status/1394318989195583490


0 likes   
CVW / MiamiensisWx / Shell Mound
The posts in this forum are NOT official forecasts and should not be used as such. They are just the opinion of the poster and may or may not be backed by sound meteorological data. They are NOT endorsed by any professional institution or STORM2K. For official information, please refer to products from the NHC and NWS.

Nuno
Category 2
Category 2
Posts: 597
Joined: Fri Aug 30, 2019 8:35 am
Location: Coral Gables, FL

Re: 2021 Indicators: SST's / SAL / MSLP / Shear / Steering / Instability / Sat Images

#488 Postby Nuno » Mon May 17, 2021 12:46 pm

Shell Mound wrote:
SFLcane wrote:
Blown Away wrote:
If that 2020 graphic was posted April 2020, amazingly accurate. The 2021 graphic suggests general track for storms through or just N of Caribbean and then begin that recurve as they near Florida.


Take with a grain of salt but that 50kt signature is draped across SFL.

https://i.postimg.cc/X76hFcwc/2021-ECsetup-1.png
The contours actually suggest a mean track over the Gulf Stream, between South Florida and Grand Bahama, en route either to South Carolina or OTS.
https://twitter.com/Nichola76551479/status/1394318989195583490


Or it could be just a SFL strike :p you don't need to try and refute everything. Products like this are just fun to look at, it honestly is impossible to determine what areas will be most targeted and even our most useful products cannot determine such.
10 likes   
Andrew (1992), Irene (1999), Frances (2004), Katrina (2005), Wilma (2005), Fay (2008), Irma (2017), Eta (2020), Ian (2022)

User avatar
crownweather
S2K Supporter
S2K Supporter
Posts: 595
Age: 50
Joined: Sat Aug 12, 2006 9:21 am
Location: Sturbridge, Massachusetts
Contact:

Re: 2021 Indicators: SST's / SAL / MSLP / Shear / Steering / Instability / Sat Images

#489 Postby crownweather » Mon May 17, 2021 12:48 pm

SFLcane wrote:Look at forecast for GOM last season. No much else to be said. Drop mic

https://twitter.com/catinsight/status/1251581242262401024


One thing to note about last year's forecast after going through the tweets - The April forecast had a central Gulf threat, which did occur. The May & June forecasts, however, all but dropped that threat & actually showed a below average wind threat.

The reason I bring this up is that last month's 50+ mph wind forecast from the European ensemble model had the same type of central Gulf threat & once again by the May forecast, it dropped that threat. My ?? is whether we are seeing the wrong type of trend & that maybe we should be looking more at the April forecast, which did very well last year.
2 likes   
Rob Lightbown
Crown Weather Services
https://crownweather.com

User avatar
SFLcane
S2K Supporter
S2K Supporter
Posts: 10163
Age: 47
Joined: Sat Jun 05, 2010 1:44 pm
Location: Lake Worth Florida

Re: 2021 Indicators: SST's / SAL / MSLP / Shear / Steering / Instability / Sat Images

#490 Postby SFLcane » Mon May 17, 2021 2:10 pm

Nuno wrote:
Shell Mound wrote:
SFLcane wrote:
Take with a grain of salt but that 50kt signature is draped across SFL.

https://i.postimg.cc/X76hFcwc/2021-ECsetup-1.png
The contours actually suggest a mean track over the Gulf Stream, between South Florida and Grand Bahama, en route either to South Carolina or OTS.
https://twitter.com/Nichola76551479/status/1394318989195583490


Or it could be just a SFL strike :p you don't need to try and refute everything. Products like this are just fun to look at, it honestly is impossible to determine what areas will be most targeted and even our most useful products cannot determine such.


Did someone just draw tracks over the 50kt probabilities lol. Yea your idea as usual is for the storm to take abrupt turn northward 2 miles of SFL and head for the Carolinas. If it were only that simple. Fact is the probability for seeing 50kt winds did increase in FL on this run. Impossible to know what areas will be affected this season if any.
7 likes   

AutoPenalti
Category 5
Category 5
Posts: 4030
Age: 29
Joined: Mon Aug 17, 2015 4:16 pm
Location: Ft. Lauderdale, Florida

Re: 2021 Indicators: SST's / SAL / MSLP / Shear / Steering / Instability / Sat Images

#491 Postby AutoPenalti » Mon May 17, 2021 2:23 pm

Shell Mound wrote:
SFLcane wrote:
Blown Away wrote:
If that 2020 graphic was posted April 2020, amazingly accurate. The 2021 graphic suggests general track for storms through or just N of Caribbean and then begin that recurve as they near Florida.


Take with a grain of salt but that 50kt signature is draped across SFL.

https://i.postimg.cc/X76hFcwc/2021-ECsetup-1.png
The contours actually suggest a mean track over the Gulf Stream, between South Florida and Grand Bahama, en route either to South Carolina or OTS.
https://twitter.com/Nichola76551479/status/1394318989195583490

Again, forecasting a track like that months in advance is fools gold.
5 likes   
The posts in this forum are NOT official forecasts and should not be used as such. They are just the opinion of the poster and may or may not be backed by sound meteorological data. They are NOT endorsed by any professional institution or STORM2K. For official information, please refer to products from the NHC and NWS.


Model Runs Cheat Sheet:
GFS (5:30 AM/PM, 11:30 AM/PM)
HWRF, GFDL, UKMET, NAVGEM (6:30-8:00 AM/PM, 12:30-2:00 AM/PM)
ECMWF (1:45 AM/PM)

TCVN
is a weighted averaged

User avatar
Category5Kaiju
Category 5
Category 5
Posts: 4095
Joined: Thu Dec 24, 2020 12:45 pm
Location: Seattle

Re: 2021 Indicators: SST's / SAL / MSLP / Shear / Steering / Instability / Sat Images

#492 Postby Category5Kaiju » Mon May 17, 2021 3:20 pm

AutoPenalti wrote:
Shell Mound wrote:
SFLcane wrote:
Take with a grain of salt but that 50kt signature is draped across SFL.

https://i.postimg.cc/X76hFcwc/2021-ECsetup-1.png
The contours actually suggest a mean track over the Gulf Stream, between South Florida and Grand Bahama, en route either to South Carolina or OTS.
https://twitter.com/Nichola76551479/status/1394318989195583490

Again, forecasting a track like that months in advance is fools gold.


As well as predicting how strong such storms could get (like how many storms of each category will occur) :D
1 likes   
Unless explicitly stated, all info in my posts is based on my own opinions and observations. Tropical storms and hurricanes can be extremely dangerous. Do not think you can beat Mother Nature. Refer to an accredited weather research agency or meteorologist if you need to make serious decisions regarding an approaching storm.

User avatar
DestinHurricane
Category 4
Category 4
Posts: 935
Joined: Tue May 01, 2018 8:05 am
Location: New York, NY

Re: 2021 Indicators: SST's / SAL / MSLP / Shear / Steering / Instability / Sat Images

#493 Postby DestinHurricane » Mon May 17, 2021 5:58 pm

Shell Mound wrote:
SFLcane wrote:
Blown Away wrote:
If that 2020 graphic was posted April 2020, amazingly accurate. The 2021 graphic suggests general track for storms through or just N of Caribbean and then begin that recurve as they near Florida.


Take with a grain of salt but that 50kt signature is draped across SFL.

https://i.postimg.cc/X76hFcwc/2021-ECsetup-1.png
The contours actually suggest a mean track over the Gulf Stream, between South Florida and Grand Bahama, en route either to South Carolina or OTS.
https://twitter.com/Nichola76551479/status/1394318989195583490


Even if this map does predict tracks, how do you know that the eye is EXACTLY between Grand Bahama and Florida? It could easily Be a Dade, Broward or PBC landfall just onshore.
1 likes   
Michael 2018

Shell Mound
Category 5
Category 5
Posts: 2434
Age: 32
Joined: Thu Sep 07, 2017 3:39 pm
Location: St. Petersburg, FL → Scandinavia

Re: 2021 Indicators: SST's / SAL / MSLP / Shear / Steering / Instability / Sat Images

#494 Postby Shell Mound » Tue May 18, 2021 12:11 am

 https://twitter.com/AndyHazelton/status/1394289029848436737


 https://twitter.com/cyclonicwx/status/1394295553643716609


 https://twitter.com/AndyHazelton/status/1394296179295391754


 https://twitter.com/AndyHazelton/status/1394363439284359171


At this rate CSU et al. will need to reduce their numbers substantially. This SST profile + African monsoon supports 2018-type numbers/indices at best.
0 likes   
CVW / MiamiensisWx / Shell Mound
The posts in this forum are NOT official forecasts and should not be used as such. They are just the opinion of the poster and may or may not be backed by sound meteorological data. They are NOT endorsed by any professional institution or STORM2K. For official information, please refer to products from the NHC and NWS.

NXStumpy_Robothing
Category 1
Category 1
Posts: 335
Age: 25
Joined: Fri Jun 05, 2020 11:50 pm
Location: North Georgia

Re: 2021 Indicators: SST's / SAL / MSLP / Shear / Steering / Instability / Sat Images

#495 Postby NXStumpy_Robothing » Tue May 18, 2021 12:50 am

Shell Mound wrote:[list of tweets, primarily from Andy Hazelton]
At this rate CSU et al. will need to reduce their numbers substantially. This SST profile + African monsoon supports 2018-type numbers/indices at best.

If SST patterns in May were the only thing that served as an indication of how active a season could be, I'd be inclined to at least partially agree. However, as noted in that series of twitter threads, the MDR is still warmer than both 2018 and 2019, just not anomalously warm like the rest of the North Atlantic is. Combined with all of the other favorable predicted factors, such as the predicted cool-neutral to weak La Nina, reduced shear, active wave train, and the semi-favorable steering pattern for longer-tracked systems, I don't really see a need for the CSU to come out with much of a reduction in their numbers unless we see some other indicators begin to switch towards a less favorable outcome for TC activity.

As a side note: even if the season turned out to be like 2018 or 2019, it's worth noting that those two seasons produced a record-setting TC-caused flooding event in both the Carolinas (Florence) and southeast Texas (Imelda), the first Category 5 storm to hit the United States at that intensity in over 25 years (Michael), one of the strongest hurricanes ever recorded by windspeed in the North Atlantic that devastated the Bahamas (Dorian), the easternmost Category 5 on record (Lorenzo), and another major hurricane that slammed Bermuda (Humberto). Just because a season may be less active than literally the most active season on record in 2020 does not mean there aren't serious effects for us here or off of the North American coastline, or even the Azores (Lorenzo again).

With that said, the current SST profile does support some mild convective suppression over the MDR, but it also likely means that a) we'll see a noticeable uptick in activity in the subtropics and b) we'll see waves struggle to develop in the MDR, move into the Eastern Caribbean/southeast Atlantic, and develop there instead. While this would probably reduce the chance for Gulf of Mexico activity to a degree, the fact that the current and forecasted conditions mean that waves will likely be developing closer to land is a serious cause for concern regardless. As for analogs, I've seen 1999 thrown around a few times on Twitter, and I think this is a decent analog. Other analogs I'd probably consider are 2011, 2012, and the aforementioned duo of 2018 and 2019. If conditions change, I could see something like 2010 (better conditions, allowing waves to develop earlier) or 2015 (worse conditions, preventing much of any development outside of the subtropics) being possible.
9 likes   
Undergraduate Meteorology Student, Georgia Institute of Technology

Shell Mound
Category 5
Category 5
Posts: 2434
Age: 32
Joined: Thu Sep 07, 2017 3:39 pm
Location: St. Petersburg, FL → Scandinavia

Re: 2021 Indicators: SST's / SAL / MSLP / Shear / Steering / Instability / Sat Images

#496 Postby Shell Mound » Tue May 18, 2021 3:11 am

NXStumpy_Robothing wrote:
Shell Mound wrote:[list of tweets, primarily from Andy Hazelton]
At this rate CSU et al. will need to reduce their numbers substantially. This SST profile + African monsoon supports 2018-type numbers/indices at best.

If SST patterns in May were the only thing that served as an indication of how active a season could be, I'd be inclined to at least partially agree. However, as noted in that series of twitter threads, the MDR is still warmer than both 2018 and 2019, just not anomalously warm like the rest of the North Atlantic is. Combined with all of the other favorable predicted factors, such as the predicted cool-neutral to weak La Nina, reduced shear, active wave train, and the semi-favorable steering pattern for longer-tracked systems, I don't really see a need for the CSU to come out with much of a reduction in their numbers unless we see some other indicators begin to switch towards a less favorable outcome for TC activity.

As a side note: even if the season turned out to be like 2018 or 2019, it's worth noting that those two seasons produced a record-setting TC-caused flooding event in both the Carolinas (Florence) and southeast Texas (Imelda), the first Category 5 storm to hit the United States at that intensity in over 25 years (Michael), one of the strongest hurricanes ever recorded by windspeed in the North Atlantic that devastated the Bahamas (Dorian), the easternmost Category 5 on record (Lorenzo), and another major hurricane that slammed Bermuda (Humberto). Just because a season may be less active than literally the most active season on record in 2020 does not mean there aren't serious effects for us here or off of the North American coastline, or even the Azores (Lorenzo again).

With that said, the current SST profile does support some mild convective suppression over the MDR, but it also likely means that a) we'll see a noticeable uptick in activity in the subtropics and b) we'll see waves struggle to develop in the MDR, move into the Eastern Caribbean/southeast Atlantic, and develop there instead. While this would probably reduce the chance for Gulf of Mexico activity to a degree, the fact that the current and forecasted conditions mean that waves will likely be developing closer to land is a serious cause for concern regardless. As for analogs, I've seen 1999 thrown around a few times on Twitter, and I think this is a decent analog. Other analogs I'd probably consider are 2011, 2012, and the aforementioned duo of 2018 and 2019. If conditions change, I could see something like 2010 (better conditions, allowing waves to develop earlier) or 2015 (worse conditions, preventing much of any development outside of the subtropics) being possible.

Image
 https://twitter.com/philklotzbach/status/1166468546261475328


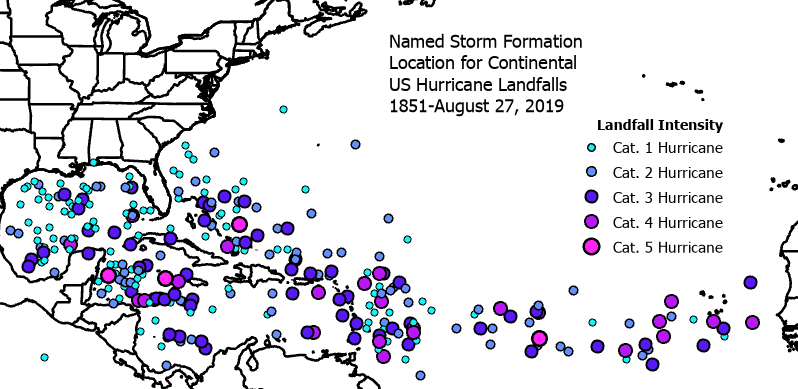
Based on these data, I retract my statement about 75% of U.S. MH forming in the MDR. Maybe that’s true since 1900, but not since 1851. Overall, more U.S. MH were homegrown than CV. However, most of the Cat-4+ U.S. landfalls clearly tended to originate in the MDR. So an active MDR tends to increase the risk of upper-tier (Cat-4+) MH impacts on the CONUS, as opposed to low-end (≤ Cat-3) hits.

A few points to mention:
  • The subtropical North Atlantic, especially the Labrador Sea, is actually warmer than it was in either 2018 or 2019. This means a greater likelihood of sinking air over the tropical Atlantic than in either of those two years.
  • 1999 featured an ACE of ~177. CSU is currently forecasting an ACE of ~150. 2018 and 2019 featured an ACE of ~132–33. Currently, I don’t see how 2021 will exceed an ACE of ~130. If anything, its ACE might be < 130.
  • I think 2021 could still deliver significant impacts, even if it ends up being near average, but those impacts are more likely to occur outside the CONUS, in my view.
1 likes   
CVW / MiamiensisWx / Shell Mound
The posts in this forum are NOT official forecasts and should not be used as such. They are just the opinion of the poster and may or may not be backed by sound meteorological data. They are NOT endorsed by any professional institution or STORM2K. For official information, please refer to products from the NHC and NWS.

USTropics
Professional-Met
Professional-Met
Posts: 2650
Joined: Sun Aug 12, 2007 3:45 am
Location: Florida State University

Re: 2021 Indicators: SST's / SAL / MSLP / Shear / Steering / Instability / Sat Images

#497 Postby USTropics » Tue May 18, 2021 6:01 am

I wouldn't do too much handwringing over SSTs in May tbh, it creates sort of a "base" for the season (i.e., starting point). It's clear why the MDR remains neutral-cold anomalies currently. Here is an analysis of May 1st - 15th 500mb heights anomalies.

Image

What do these anomalies show? If we apply some basic meteorology concepts (such as wind flow around high/low pressures), we can establish what we will expect to see on wind zonal anomalies. Namely, flow south away from the anomalous high pressure over much of the subtropical Atlantic has increased trade flow over much of the MDR. Here is the same output with a general idea of wind vectors currently and how this impacts sea surface temperatures:

Image

We can further analyze this using 850mb zonal wind anomalies (purple = anomalous easterly flow, red = anomalous westerly flow):

Image

What does all of this have to do with sea surface temperatures? Increased trades (easterly flow as seen above) reduces warming over the MDR region (SSTA -). Anomalous high pressure over the subtropics reduce wind flow in this region (SSTA +). The same general flow is also seen south of the MDR (due to high pressure over South America/South Atlantic) and is also creating the same effect (SSTA +).

We also must keep in mind how this wind pattern impacts the conveyor belt of water flow in the Atlantic (i.e., ocean currents). First here is an output of the current sea surface temperatures in the Atlantic:
Image

Now overlay this with some rough estimates of ocean currents in the north Atlantic, and keep in mind the earlier wind vectors that were analyzed in the 500mb heights anomalies above.
Image

The currents in white are the main equatorial currents that act to drive warm water away from the equator towards the poles (i.e., redistribution of energy towards the higher latitudes). The Gulf Stream current (in pink) is known as a western boundary current, with its main purpose to also redistribute warm water in the tropics poleward. We also have what is known as the Canary current (in blue), which is an eastern boundary current—the main purpose of the Canary current is to transport colder water from the higher latitudes towards the lower latitudes. Highlighted in green is the Atlantic's North Equatorial Counter Current (NECC). This is known as a wind-driven current, as it primary lies at the surface of the ocean and is highly subject to seasonal wind forcing (due to a shrinking of Corolisis parameters along the equator).

So again, overlaying the wind vectors from earlier we are seeing: (1) increased trade winds along the MDR, which enhances the flow of the equatorial currents (i.e., enhances flow of warm water away from the tropics to the subtropics), (2) high pressure off the EC enhances the Gulf Stream flow, which also enhances flow of warm water poleward away from the tropics, (3) flow around the high pressure area in the eastern Atlantic enhances the Canary current, distributing cold water to the tropics (keep in mind SSTAs show this anomalously warm, but actual temperatures, as seen above, is still much cooler waters compared to temperatures in the MDR), and (4) enhanced westerly flow south of the equator enhances the NECC, which lets anomalously warmer water remain east of 20W near Africa.

Now using all this information, we can start to see why we have an SSTA configuration that is currently in the Atlantic:
Image

So what would change this current profile? As other commenters have stated, a relaxation in trade winds is a start. A displacement of the anomalous high pressure that has been over the subtropical/central Atlantic would also displace wind flow. We can already see these processes occurring (and remember, sea surface temperature adjustments are not immediate, it often takes weeks to respond to atmospheric changes). For example, here was the SST trend for the first day of May 2021 (which takes into account the last week of April):

Image

Stretched high pressure and zonal flow across the subtropics had enhanced warming (SSTA +) along the entire subtropics. Since, that high pressure area has centered more towards the eastern Atlantic, which has created upwelling along the NW coast of Africa (SSTA -), drives warming along the western African coast (SSTA +), and we can see the most enhanced warming is now in the eastern subtropics (per the 7-day trend):
Image

So TLDR: atmospheric setups are fluid and difficult to forecast; it's impossible the current SSTA signature will be the same in July, let alone by ASO. Consider May SSTAs a starting base, but not a projection for future SSTAs. Modeling of atmospheric patterns will provide a better determination of this (see 500mb height anomaly forecasts and 850mb zonal wind anomaly forecasts from seasonal models, like the CFS model at TT - https://www.tropicaltidbits.com/analysi ... 51718&fh=1, seasonal model output at Copernicus - https://climate.copernicus.eu/seasonal-forecasts, or the NMME model - https://www.cpc.ncep.noaa.gov/products/ ... anom.shtml).
15 likes   

User avatar
Category5Kaiju
Category 5
Category 5
Posts: 4095
Joined: Thu Dec 24, 2020 12:45 pm
Location: Seattle

Re: 2021 Indicators: SST's / SAL / MSLP / Shear / Steering / Instability / Sat Images

#498 Postby Category5Kaiju » Tue May 18, 2021 6:59 am

I would also like to say that 2018 and 2019 were years with activity that was partially influenced by El Niño; in 2018 the El Niño developed later than expected, but the gradual transition toward that ENSO phase really boosted the EPAC and somewhat calmed the Atlantic, and 2019 came off of the death of that El Niño, yet the lingering shear as a result of the atmosphere taking time to respond to the abrupt change I would think was one reason why aside from Dorian and Lorenzo many of the storms were weak. Either way, the way I see things is while the sst profile may look like this now, as seen in years like 1999 and even 2019 to an extent ASO may very well tell a different story.

Also this is a question I have had out of pure curiosity, but why do people look at the MDR sst anomalies specifically to judge whether a season will be active or not? Like if the MDR was cool and the subtropics and Gulf for instance were warm, wouldn’t that simply allow waves to develop closer to land and not really affect overall activity (ACE score perhaps, but wouldn’t the number of NS or H not be all that affected)?
1 likes   
Unless explicitly stated, all info in my posts is based on my own opinions and observations. Tropical storms and hurricanes can be extremely dangerous. Do not think you can beat Mother Nature. Refer to an accredited weather research agency or meteorologist if you need to make serious decisions regarding an approaching storm.

User avatar
NotSparta
Professional-Met
Professional-Met
Posts: 1668
Age: 23
Joined: Fri Aug 18, 2017 8:24 am
Location: Naples, FL
Contact:

Re: 2021 Indicators: SST's / SAL / MSLP / Shear / Steering / Instability / Sat Images

#499 Postby NotSparta » Tue May 18, 2021 8:58 am

Shell Mound wrote:At this rate CSU et al. will need to reduce their numbers substantially. This SST profile + African monsoon supports 2018-type numbers/indices at best.


Just because the SSTs aren't as warm as 2020 shouldn't be a reason to cap a forecast that low, especially when there is no +ENSO like in 2018
0 likes   
This post was probably an opinion of mine, and in no way is official. Please refer to http://www.hurricanes.gov for official tropical analysis and advisories.

My website, with lots of tropical wx graphics, including satellite and recon: http://cyclonicwx.com

Shell Mound
Category 5
Category 5
Posts: 2434
Age: 32
Joined: Thu Sep 07, 2017 3:39 pm
Location: St. Petersburg, FL → Scandinavia

Re: 2021 Indicators: SST's / SAL / MSLP / Shear / Steering / Instability / Sat Images

#500 Postby Shell Mound » Tue May 18, 2021 9:30 am

NotSparta wrote:
Shell Mound wrote:At this rate CSU et al. will need to reduce their numbers substantially. This SST profile + African monsoon supports 2018-type numbers/indices at best.

Just because the SSTs aren't as warm as 2020 shouldn't be a reason to cap a forecast that low, especially when there is no +ENSO like in 2018

Perhaps I’m too conservative. On another note, why do you think the subtropical ridge has been stronger than expected during the recent, prolonged -NAO episode?
1 likes   
CVW / MiamiensisWx / Shell Mound
The posts in this forum are NOT official forecasts and should not be used as such. They are just the opinion of the poster and may or may not be backed by sound meteorological data. They are NOT endorsed by any professional institution or STORM2K. For official information, please refer to products from the NHC and NWS.


Return to “Talkin' Tropics”

Who is online

Users browsing this forum: NotSparta and 44 guests