2021 Indicators: SST's / SAL / MSLP / Shear / Steering / Instability / Sat Images

This is the general tropical discussion area. Anyone can take their shot at predicting a storms path.

Moderator: S2k Moderators

Forum rules

The posts in this forum are NOT official forecasts and should not be used as such. They are just the opinion of the poster and may or may not be backed by sound meteorological data. They are NOT endorsed by any professional institution or STORM2K. For official information, please refer to products from the National Hurricane Center and National Weather Service.

Help Support Storm2K
Message
Author
Shell Mound
Category 5
Category 5
Posts: 2434
Age: 32
Joined: Thu Sep 07, 2017 3:39 pm
Location: St. Petersburg, FL → Scandinavia

Re: 2021 Indicators: SST's / SAL / MSLP / Shear / Steering / Instability / Sat Images

#541 Postby Shell Mound » Mon May 24, 2021 7:09 am

toad strangler wrote:
Shell Mound wrote:
SFLcane wrote:Say goodbye to your cool MDR per the CFS the switch is about to Flip. I do not have a weatherbell account to view the CFS daily but i was able to grab a screen shot of June26 via youtube. Check out those anomalies off the african coast! There is a hole there its do to the way its display but if it weren't there i'd bet you would have yourself an above average basin.

This is June 26th... we shall see in a few weeks if it verifies.

https://i.imgur.com/X4V4jzk.png

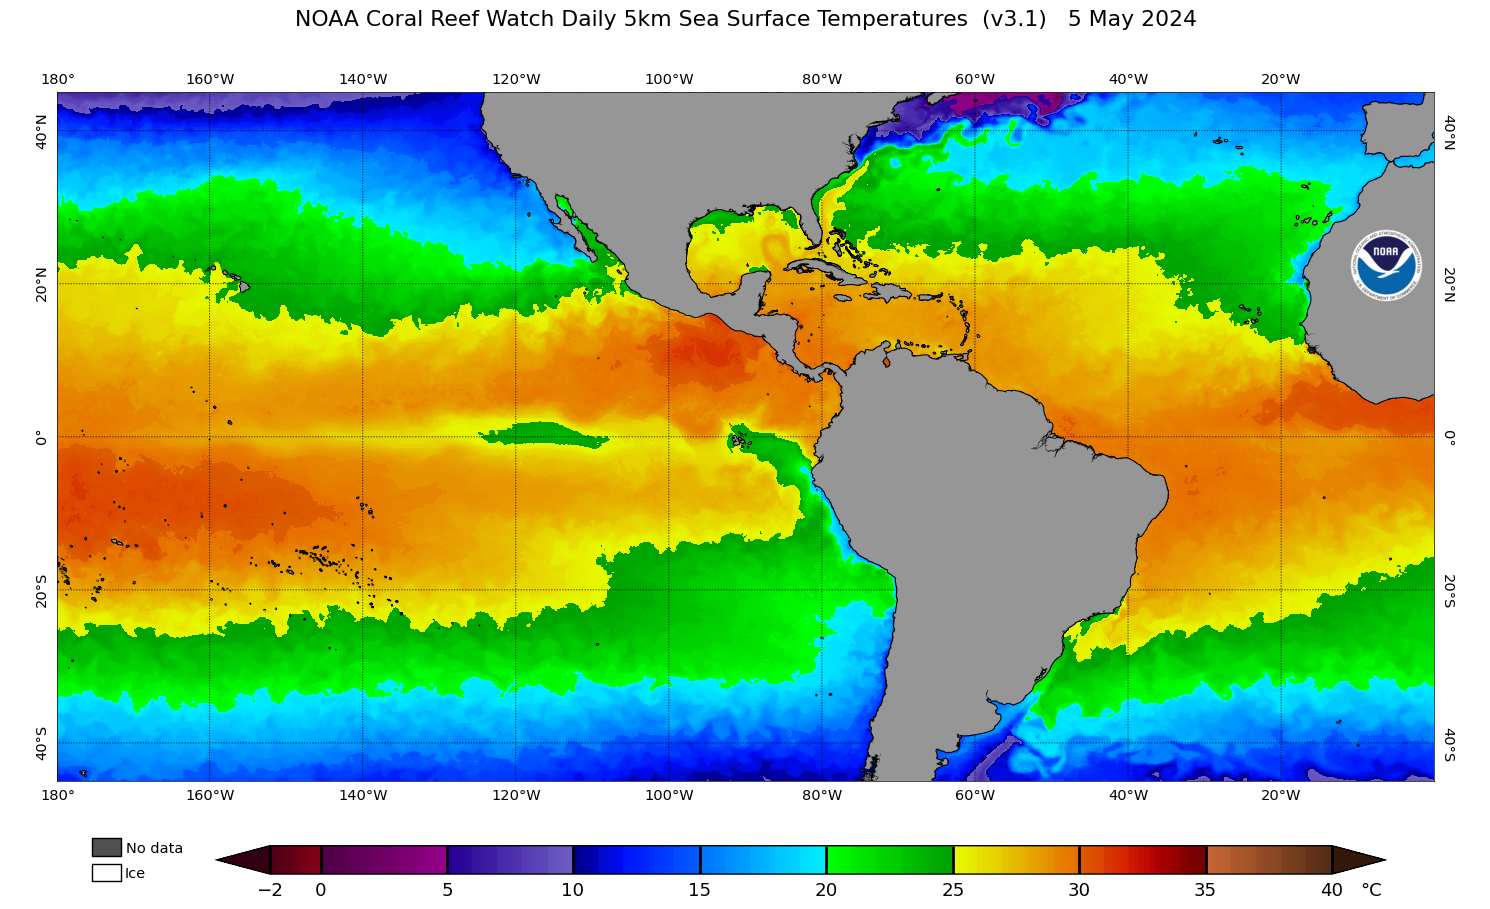
So far SST in the MDR have remained steady over the past week and a half, despite prolonged laxity of trades, so this forecast is likely to bust significantly.

As an aside, Ana’s track has been/is very similar to Arlene’s (1999). If so, I’m expecting more of a threat to the Carolinas than South Florida during ASO.

Analogs are for comparing background states and individual basin indicators. Not tracks IMO.

Privately, last year I examined the tracks of the first three or four storms and extrapolated patterns expected to recur based on those tracks. I found that subsequent tracks tended to match my expectations fairly well, in terms of trajectories at given coordinates, correlating well with mean steering currents. For example, Arthur’s location parabolic trajectory suggested some kind of col between blocking ridges that would enable threats to extreme southern FL and/or the Carolinas. This ended up happening with Isaac, Sally, and Eta. Based on a blend of the EC, NMME, SST analogs, and Ana’s track, some analogs that I came up with were 1862, 1906, 1936, 1999, and 2017. These years tended to feature hurricane impacts on South TX (three), between Gulfport MS and Destin FL (three), on South FL (four), and over or near the Carolinas (five). Based on these I am placing the Carolinas at highest risk of a hurricane impact, followed by South FL.
0 likes   
CVW / MiamiensisWx / Shell Mound
The posts in this forum are NOT official forecasts and should not be used as such. They are just the opinion of the poster and may or may not be backed by sound meteorological data. They are NOT endorsed by any professional institution or STORM2K. For official information, please refer to products from the NHC and NWS.

User avatar
CyclonicFury
Category 5
Category 5
Posts: 2025
Age: 26
Joined: Sun Jul 02, 2017 12:32 pm
Location: NC
Contact:

Re: 2021 Indicators: SST's / SAL / MSLP / Shear / Steering / Instability / Sat Images

#542 Postby CyclonicFury » Mon May 24, 2021 1:30 pm

There are striking similarities between 2020 and 2021 in the Atlantic SSTA profile at this time, though I obviously wouldn't expect to see anywhere close to 30 named storms again. There are some slight differences, such as 2020 having a slightly warmer MDR than this year, as well as this year having a warmer NW Atlantic than 2020. The MDR warmed significantly in June last year to well-above-normal levels, so it will be interesting to see if that happens again (but 2020 still did not turn out to be a big MDR season, despite the overall hyperactivity).

Image
Image
5 likes   
NCSU B.S. in Meteorology Class of 2021. Tropical weather blogger at http://www.cyclonicfury.com. My forecasts and thoughts are NOT official, for official forecasts please consult the National Hurricane Center.

User avatar
Category5Kaiju
Category 5
Category 5
Posts: 4095
Joined: Thu Dec 24, 2020 12:45 pm
Location: Seattle

Re: 2021 Indicators: SST's / SAL / MSLP / Shear / Steering / Instability / Sat Images

#543 Postby Category5Kaiju » Mon May 24, 2021 1:59 pm

CyclonicFury wrote:There are striking similarities between 2020 and 2021 in the Atlantic SSTA profile at this time, though I obviously wouldn't expect to see anywhere close to 30 named storms again. There are some slight differences, such as 2020 having a slightly warmer MDR than this year, as well as this year having a warmer NW Atlantic than 2020. The MDR warmed significantly in June last year to well-above-normal levels, so it will be interesting to see if that happens again (but 2020 still did not turn out to be a big MDR season, despite the overall hyperactivity).

https://i.imgur.com/nUpzaFa.gif
https://i.imgur.com/uuflMGV.gif


I think it is important to note that 2020 was not much of an MDR season because of several factors, the most glaring imho being the TUTT and the Godzilla dust cloud in June. In terms of Sahara dust, I am not sure if 2021 will see such a massive dust outbreak like last year, which I would assume would be a pro over 2020. Because if I am not incorrect, the very strong WAM last year kind of was to blame for that?
0 likes   
Unless explicitly stated, all info in my posts is based on my own opinions and observations. Tropical storms and hurricanes can be extremely dangerous. Do not think you can beat Mother Nature. Refer to an accredited weather research agency or meteorologist if you need to make serious decisions regarding an approaching storm.

User avatar
CyclonicFury
Category 5
Category 5
Posts: 2025
Age: 26
Joined: Sun Jul 02, 2017 12:32 pm
Location: NC
Contact:

Re: 2021 Indicators: SST's / SAL / MSLP / Shear / Steering / Instability / Sat Images

#544 Postby CyclonicFury » Mon May 24, 2021 2:09 pm

Category5Kaiju wrote:
CyclonicFury wrote:There are striking similarities between 2020 and 2021 in the Atlantic SSTA profile at this time, though I obviously wouldn't expect to see anywhere close to 30 named storms again. There are some slight differences, such as 2020 having a slightly warmer MDR than this year, as well as this year having a warmer NW Atlantic than 2020. The MDR warmed significantly in June last year to well-above-normal levels, so it will be interesting to see if that happens again (but 2020 still did not turn out to be a big MDR season, despite the overall hyperactivity).

https://i.imgur.com/nUpzaFa.gif
https://i.imgur.com/uuflMGV.gif


I think it is important to note that 2020 was not much of an MDR season because of several factors, the most glaring imho being the TUTT and the Godzilla dust cloud in June. In terms of Sahara dust, I am not sure if 2021 will see such a massive dust outbreak like last year, which I would assume would be a pro over 2020. Because if I am not incorrect, the very strong WAM last year kind of was to blame for that?

I don't think the June dust outbreak meant anything for the peak of the season. The weak activity in the MDR was more of a result of the strong TUTT near peak (related to a couple typhoons downstream response) as well as large, disorganized disturbances that struggled to consolidate quickly.
4 likes   
NCSU B.S. in Meteorology Class of 2021. Tropical weather blogger at http://www.cyclonicfury.com. My forecasts and thoughts are NOT official, for official forecasts please consult the National Hurricane Center.

AutoPenalti
Category 5
Category 5
Posts: 4030
Age: 29
Joined: Mon Aug 17, 2015 4:16 pm
Location: Ft. Lauderdale, Florida

Re: 2021 Indicators: SST's / SAL / MSLP / Shear / Steering / Instability / Sat Images

#545 Postby AutoPenalti » Mon May 24, 2021 2:21 pm

CyclonicFury wrote:
Category5Kaiju wrote:
CyclonicFury wrote:There are striking similarities between 2020 and 2021 in the Atlantic SSTA profile at this time, though I obviously wouldn't expect to see anywhere close to 30 named storms again. There are some slight differences, such as 2020 having a slightly warmer MDR than this year, as well as this year having a warmer NW Atlantic than 2020. The MDR warmed significantly in June last year to well-above-normal levels, so it will be interesting to see if that happens again (but 2020 still did not turn out to be a big MDR season, despite the overall hyperactivity).

https://i.imgur.com/nUpzaFa.gif
https://i.imgur.com/uuflMGV.gif


I think it is important to note that 2020 was not much of an MDR season because of several factors, the most glaring imho being the TUTT and the Godzilla dust cloud in June. In terms of Sahara dust, I am not sure if 2021 will see such a massive dust outbreak like last year, which I would assume would be a pro over 2020. Because if I am not incorrect, the very strong WAM last year kind of was to blame for that?

I don't think the June dust outbreak meant anything for the peak of the season. The weak activity in the MDR was more of a result of the strong TUTT near peak (related to a couple typhoons downstream response) as well as large, disorganized disturbances that struggled to consolidate quickly.

I thought it was more to do with the hyperactive WAM that created a multitude of waves or vorticies so close together resulting in consolidation issues.
0 likes   
The posts in this forum are NOT official forecasts and should not be used as such. They are just the opinion of the poster and may or may not be backed by sound meteorological data. They are NOT endorsed by any professional institution or STORM2K. For official information, please refer to products from the NHC and NWS.


Model Runs Cheat Sheet:
GFS (5:30 AM/PM, 11:30 AM/PM)
HWRF, GFDL, UKMET, NAVGEM (6:30-8:00 AM/PM, 12:30-2:00 AM/PM)
ECMWF (1:45 AM/PM)

TCVN
is a weighted averaged

User avatar
Category5Kaiju
Category 5
Category 5
Posts: 4095
Joined: Thu Dec 24, 2020 12:45 pm
Location: Seattle

Re: 2021 Indicators: SST's / SAL / MSLP / Shear / Steering / Instability / Sat Images

#546 Postby Category5Kaiju » Mon May 24, 2021 2:25 pm

AutoPenalti wrote:
CyclonicFury wrote:
Category5Kaiju wrote:
I think it is important to note that 2020 was not much of an MDR season because of several factors, the most glaring imho being the TUTT and the Godzilla dust cloud in June. In terms of Sahara dust, I am not sure if 2021 will see such a massive dust outbreak like last year, which I would assume would be a pro over 2020. Because if I am not incorrect, the very strong WAM last year kind of was to blame for that?

I don't think the June dust outbreak meant anything for the peak of the season. The weak activity in the MDR was more of a result of the strong TUTT near peak (related to a couple typhoons downstream response) as well as large, disorganized disturbances that struggled to consolidate quickly.

I thought it was more to do with the hyperactive WAM that created a multitude of waves or vorticies so close together resulting in consolidation issues.


I think that was also a detrimental factor too. Either way, there were definitely multiple factors that caused last year to not be an MDR-focused year. Whether 2021 is the same or different is something we should monitor over the course of the next months
0 likes   
Unless explicitly stated, all info in my posts is based on my own opinions and observations. Tropical storms and hurricanes can be extremely dangerous. Do not think you can beat Mother Nature. Refer to an accredited weather research agency or meteorologist if you need to make serious decisions regarding an approaching storm.

User avatar
Hammy
Category 5
Category 5
Posts: 5849
Age: 41
Joined: Fri May 25, 2012 5:25 pm
Contact:

Re: 2021 Indicators: SST's / SAL / MSLP / Shear / Steering / Instability / Sat Images

#547 Postby Hammy » Mon May 24, 2021 8:02 pm

AutoPenalti wrote:
CyclonicFury wrote:
Category5Kaiju wrote:
I think it is important to note that 2020 was not much of an MDR season because of several factors, the most glaring imho being the TUTT and the Godzilla dust cloud in June. In terms of Sahara dust, I am not sure if 2021 will see such a massive dust outbreak like last year, which I would assume would be a pro over 2020. Because if I am not incorrect, the very strong WAM last year kind of was to blame for that?

I don't think the June dust outbreak meant anything for the peak of the season. The weak activity in the MDR was more of a result of the strong TUTT near peak (related to a couple typhoons downstream response) as well as large, disorganized disturbances that struggled to consolidate quickly.

I thought it was more to do with the hyperactive WAM that created a multitude of waves or vorticies so close together resulting in consolidation issues.


The WAM seemed to be a factors for a variety of reasons, not just this but also being too far north (several potentially stronger storms went over cooler waters for too long) not to mention the higher than normal latitude also contributed to the large scale dust outbreaks in the first place.
2 likes   
The above post is not official and should not be used as such. It is the opinion of the poster and may or may not be backed by sound meteorological data. It is not endorsed by any professional institution or storm2k.org. For official information, please refer to the NHC and NWS products.

User avatar
SFLcane
S2K Supporter
S2K Supporter
Posts: 10163
Age: 47
Joined: Sat Jun 05, 2010 1:44 pm
Location: Lake Worth Florida

Re: 2021 Indicators: SST's / SAL / MSLP / Shear / Steering / Instability / Sat Images

#548 Postby SFLcane » Mon May 24, 2021 9:37 pm

CyclonicFury wrote:There are striking similarities between 2020 and 2021 in the Atlantic SSTA profile at this time, though I obviously wouldn't expect to see anywhere close to 30 named storms again. There are some slight differences, such as 2020 having a slightly warmer MDR than this year, as well as this year having a warmer NW Atlantic than 2020. The MDR warmed significantly in June last year to well-above-normal levels, so it will be interesting to see if that happens again (but 2020 still did not turn out to be a big MDR season, despite the overall hyperactivity).

https://i.imgur.com/nUpzaFa.gif
https://i.imgur.com/uuflMGV.gif


We will see as the cfs rapidly warms the tropical Atlantic in June. The dry air and wave breaking really hurt the MDR last year. Goes to show even if the mdr is not producing we could still have a bad season concerning impacts.
0 likes   

User avatar
Category5Kaiju
Category 5
Category 5
Posts: 4095
Joined: Thu Dec 24, 2020 12:45 pm
Location: Seattle

Re: 2021 Indicators: SST's / SAL / MSLP / Shear / Steering / Instability / Sat Images

#549 Postby Category5Kaiju » Mon May 24, 2021 11:29 pm

It is interesting to note that 3 of the 4 Cat 5 hurricanes that hit the US at such strength did not even originate in the MDR. This merely an example of how a non-MDR focused season or storm could arguably be worse in the sense that land is more endangered, and especially with rapid intensification close to land, many coastal residents would easily be caught off guard.
5 likes   
Unless explicitly stated, all info in my posts is based on my own opinions and observations. Tropical storms and hurricanes can be extremely dangerous. Do not think you can beat Mother Nature. Refer to an accredited weather research agency or meteorologist if you need to make serious decisions regarding an approaching storm.

Shell Mound
Category 5
Category 5
Posts: 2434
Age: 32
Joined: Thu Sep 07, 2017 3:39 pm
Location: St. Petersburg, FL → Scandinavia

Re: 2021 Indicators: SST's / SAL / MSLP / Shear / Steering / Instability / Sat Images

#550 Postby Shell Mound » Tue May 25, 2021 5:40 am

CyclonicFury wrote:There are striking similarities between 2020 and 2021 in the Atlantic SSTA profile at this time, though I obviously wouldn't expect to see anywhere close to 30 named storms again. There are some slight differences, such as 2020 having a slightly warmer MDR than this year, as well as this year having a warmer NW Atlantic than 2020. The MDR warmed significantly in June last year to well-above-normal levels, so it will be interesting to see if that happens again (but 2020 still did not turn out to be a big MDR season, despite the overall hyperactivity).

https://i.imgur.com/nUpzaFa.gif
https://i.imgur.com/uuflMGV.gif

However, note that the Labrador Sea and the northwestern North Atlantic are considerably warmer than in 2020, implying more of a -AMO than was seen last year.

At this point, I am still rather skeptical of the view that CSU’s call for seasonal ACE of ≥ 150 will verify. The CFSv2 has a clear warm bias in its forecast for June SST.

Currently, the MDR is still lagging and taking considerable time to warm up, so as of now there are no clear signs that the CFSv2 will come close to verifying.

On the other hand:

 https://twitter.com/antmasiello/status/1394992919950548998


 https://twitter.com/antmasiello/status/1394993612321173505


 https://twitter.com/antmasiello/status/1394994400284102669


 https://twitter.com/AndyHazelton/status/1394994823749320705


 https://twitter.com/cyclonicwx/status/1395008202178170880


Last edited by Shell Mound on Tue May 25, 2021 6:04 am, edited 4 times in total.
0 likes   
CVW / MiamiensisWx / Shell Mound
The posts in this forum are NOT official forecasts and should not be used as such. They are just the opinion of the poster and may or may not be backed by sound meteorological data. They are NOT endorsed by any professional institution or STORM2K. For official information, please refer to products from the NHC and NWS.

Shell Mound
Category 5
Category 5
Posts: 2434
Age: 32
Joined: Thu Sep 07, 2017 3:39 pm
Location: St. Petersburg, FL → Scandinavia

Re: 2021 Indicators: SST's / SAL / MSLP / Shear / Steering / Instability / Sat Images

#551 Postby Shell Mound » Tue May 25, 2021 5:53 am

Category5Kaiju wrote:It is interesting to note that 3 of the 4 Cat 5 hurricanes that hit the US at such strength did not even originate in the MDR. This merely an example of how a non-MDR focused season or storm could arguably be worse in the sense that land is more endangered, and especially with rapid intensification close to land, many coastal residents would easily be caught off guard.

However, a season with less development in the MDR also tends to feature more compact storms overall, owing to greater static stability. Smaller storms tend to produce more limited impacts, however severe. The 1935 hurricane, Camille, and Michael featured relatively narrow swaths of extreme wind-and-surge-caused impacts. (Incidentally, so did Andrew, which developed in the MDR.) Historically, excluding those three Cat-5 “exceptions,” most of the Category-4+ hurricanes to strike the mainland U.S. originated in the MDR. The ones that did tended to be much larger and therefore deliver extreme impacts across a wider area. The 1900/1915 Galveston hurricanes, the 1926 Miami hurricane, the 1928 Okeechobee hurricane, the 1947 Fort Lauderdale hurricane, the 1949 Florida hurricane, and Hugo (1989) were both large and intense storms at landfall. A tiny but extremely intense storm, by contrast, poses less of a threat, given that a slight deviation could easily spare a vulnerable area. Despite all the big impacts over the past several seasons, the mainland U.S. has not yet seen a large and certifiable Cat-4+ strike. (Yes, Irma “officially” counts as a large Cat-4+ impact, but personally I am skeptical that it was a legitimate Cat-4+ in the Keys, given its sheared appearance and the absence of confirmation from reconnaissance, radar, or surface data. I think Irma’s true MSW in the Keys was on the order of 105–110 kt.) Imagine, on the other hand, a solid and enormous Cat-4+ like the 1926 Miami hurricane or even Carla (1961). That would be far worse than even Michael was, in certain respects, especially if it were moving more slowly. Take, say, Katrina, add 10–20 kt to the “official” MSW at landfall, and observe the difference.
0 likes   
CVW / MiamiensisWx / Shell Mound
The posts in this forum are NOT official forecasts and should not be used as such. They are just the opinion of the poster and may or may not be backed by sound meteorological data. They are NOT endorsed by any professional institution or STORM2K. For official information, please refer to products from the NHC and NWS.

User avatar
aspen
Category 5
Category 5
Posts: 8818
Joined: Sat Oct 12, 2019 7:10 pm
Location: Connecticut, USA

Re: 2021 Indicators: SST's / SAL / MSLP / Shear / Steering / Instability / Sat Images

#552 Postby aspen » Tue May 25, 2021 2:36 pm

There continues to be cooling and cool anomalies across the entire Atlantic tropics. The MDR remains around 0.3C below average, and the Caribbean and Gulf have now cooled to below-average too. There has been exceptional cooling over the last week in parts of the Gulf, Keys, and Bahamas. Despite that CFS run and Phil believing the MDR will warm up and the warm strip will migrate south, this setup has refused to budge.

Honestly, I’m really starting to think this season could bust dramatically. We’ve been waiting for weeks for the tropics to even get back up to average, but they’ve only cooled more. It’s not like this is in March or April; we’re barely a week from the official start of the season.
1 likes   
Irene '11 Sandy '12 Hermine '16 5/15/2018 Derecho Fay '20 Isaias '20 Elsa '21 Henri '21 Ida '21

I am only a meteorology enthusiast who knows a decent amount about tropical cyclones. Look to the professional mets, the NHC, or your local weather office for the best information.

AutoPenalti
Category 5
Category 5
Posts: 4030
Age: 29
Joined: Mon Aug 17, 2015 4:16 pm
Location: Ft. Lauderdale, Florida

Re: 2021 Indicators: SST's / SAL / MSLP / Shear / Steering / Instability / Sat Images

#553 Postby AutoPenalti » Tue May 25, 2021 4:18 pm

aspen wrote:There continues to be cooling and cool anomalies across the entire Atlantic tropics. The MDR remains around 0.3C below average, and the Caribbean and Gulf have now cooled to below-average too. There has been exceptional cooling over the last week in parts of the Gulf, Keys, and Bahamas. Despite that CFS run and Phil believing the MDR will warm up and the warm strip will migrate south, this setup has refused to budge.

Honestly, I’m really starting to think this season could bust dramatically. We’ve been waiting for weeks for the tropics to even get back up to average, but they’ve only cooled more. It’s not like this is in March or April; we’re barely a week from the official start of the season.

It’s the end of May.

Now, if this continues before we get into ASO then maybe it will be a different story.
3 likes   
The posts in this forum are NOT official forecasts and should not be used as such. They are just the opinion of the poster and may or may not be backed by sound meteorological data. They are NOT endorsed by any professional institution or STORM2K. For official information, please refer to products from the NHC and NWS.


Model Runs Cheat Sheet:
GFS (5:30 AM/PM, 11:30 AM/PM)
HWRF, GFDL, UKMET, NAVGEM (6:30-8:00 AM/PM, 12:30-2:00 AM/PM)
ECMWF (1:45 AM/PM)

TCVN
is a weighted averaged

User avatar
toad strangler
S2K Supporter
S2K Supporter
Posts: 4543
Joined: Sun Jul 28, 2013 3:09 pm
Location: Earth
Contact:

Re: 2021 Indicators: SST's / SAL / MSLP / Shear / Steering / Instability / Sat Images

#554 Postby toad strangler » Tue May 25, 2021 5:27 pm

aspen wrote:There continues to be cooling and cool anomalies across the entire Atlantic tropics. The MDR remains around 0.3C below average, and the Caribbean and Gulf have now cooled to below-average too. There has been exceptional cooling over the last week in parts of the Gulf, Keys, and Bahamas. Despite that CFS run and Phil believing the MDR will warm up and the warm strip will migrate south, this setup has refused to budge.

Honestly, I’m really starting to think this season could bust dramatically. We’ve been waiting for weeks for the tropics to even get back up to average, but they’ve only cooled more. It’s not like this is in March or April; we’re barely a week from the official start of the season.


IMO you are putting way too many eggs in the SST basket and way too early. Similar to the reaction we see with June / July SAL plumes. It's almost 3 full months before the start of true peak season. That a QUARTER of a YEAR away.
1 likes   

User avatar
Category5Kaiju
Category 5
Category 5
Posts: 4095
Joined: Thu Dec 24, 2020 12:45 pm
Location: Seattle

Re: 2021 Indicators: SST's / SAL / MSLP / Shear / Steering / Instability / Sat Images

#555 Postby Category5Kaiju » Tue May 25, 2021 5:27 pm

What I personally am curious about is why the Atlantic remains cool. I still expect warming in the summer months, but to be honest at this point I feel like there are 2 camps: the ones who think warming will occur and those who think the May sst profile will indeed last into ASO and make this season bust.

Btw at around this same timeframe (late May), I decided for fun to look back at the 2020 sst indicators thread, and while I am not trying to point out any particular person here, back then there were also rumbles of a below average season when the MDR cooled a bit; in my personal opinion, there is much more to a season's potential than seeing above average sst anomalies in the month of May. Heck, even 2013 featured a very warm MDR at around this time, and we all know how that turned out.

http://www.storm2k.org/phpbb2/viewtopic.php?f=31&t=120763&start=580
Also here is the particular part of the 2020 sst indicators thread that really intrigued me and I believe possesses some key info that can be relevant to what could happen this season as well.
3 likes   
Unless explicitly stated, all info in my posts is based on my own opinions and observations. Tropical storms and hurricanes can be extremely dangerous. Do not think you can beat Mother Nature. Refer to an accredited weather research agency or meteorologist if you need to make serious decisions regarding an approaching storm.

User avatar
aspen
Category 5
Category 5
Posts: 8818
Joined: Sat Oct 12, 2019 7:10 pm
Location: Connecticut, USA

Re: 2021 Indicators: SST's / SAL / MSLP / Shear / Steering / Instability / Sat Images

#556 Postby aspen » Tue May 25, 2021 6:08 pm

Category5Kaiju wrote:What I personally am curious about is why the Atlantic remains cool. I still expect warming in the summer months, but to be honest at this point I feel like there are 2 camps: the ones who think warming will occur and those who think the May sst profile will indeed last into ASO and make this season bust.

Btw at around this same timeframe (late May), I decided for fun to look back at the 2020 sst indicators thread, and while I am not trying to point out any particular person here, back then there were also rumbles of a below average season when the MDR cooled a bit; in my personal opinion, there is much more to a season's potential than seeing above average sst anomalies in the month of May. Heck, even 2013 featured a very warm MDR at around this time, and we all know how that turned out.

http://www.storm2k.org/phpbb2/viewtopic.php?f=31&t=120763&start=580
Also here is the particular part of the 2020 sst indicators thread that really intrigued me and I believe possesses some key info that can be relevant to what could happen this season as well.

One of the posts on that page has the May SST maps of various hyperactive seasons. Most had warmer MDRs than May 2020 or May 2021, but two — 1999 and 2003 — had comparable setups with a cooler MDR and a warmer strip in the subtropics. So that doesn’t mean this current setup is automatically going to make the season bust....but it will if the MDR fails to warm up to average or higher temps come July.
0 likes   
Irene '11 Sandy '12 Hermine '16 5/15/2018 Derecho Fay '20 Isaias '20 Elsa '21 Henri '21 Ida '21

I am only a meteorology enthusiast who knows a decent amount about tropical cyclones. Look to the professional mets, the NHC, or your local weather office for the best information.

User avatar
Category5Kaiju
Category 5
Category 5
Posts: 4095
Joined: Thu Dec 24, 2020 12:45 pm
Location: Seattle

Re: 2021 Indicators: SST's / SAL / MSLP / Shear / Steering / Instability / Sat Images

#557 Postby Category5Kaiju » Tue May 25, 2021 6:12 pm

aspen wrote:
Category5Kaiju wrote:What I personally am curious about is why the Atlantic remains cool. I still expect warming in the summer months, but to be honest at this point I feel like there are 2 camps: the ones who think warming will occur and those who think the May sst profile will indeed last into ASO and make this season bust.

Btw at around this same timeframe (late May), I decided for fun to look back at the 2020 sst indicators thread, and while I am not trying to point out any particular person here, back then there were also rumbles of a below average season when the MDR cooled a bit; in my personal opinion, there is much more to a season's potential than seeing above average sst anomalies in the month of May. Heck, even 2013 featured a very warm MDR at around this time, and we all know how that turned out.

http://www.storm2k.org/phpbb2/viewtopic.php?f=31&t=120763&start=580
Also here is the particular part of the 2020 sst indicators thread that really intrigued me and I believe possesses some key info that can be relevant to what could happen this season as well.

One of the posts on that page has the May SST maps of various hyperactive seasons. Most had warmer MDRs than May 2020 or May 2021, but two — 1999 and 2003 — had comparable setups with a cooler MDR and a warmer strip in the subtropics. So that doesn’t mean this current setup is automatically going to make the season bust....but it will if the MDR fails to warm up to average or higher temps come July.


Well yeah, by then if the sst anomalies are cool then I think a bust is definitely probable. Let's see what happens this summer, to be fair if the Atlantic fails to warm up by then I would certainly be very interested to know why as that would truly defy my expectations based on the patterns seen in recent years.
3 likes   
Unless explicitly stated, all info in my posts is based on my own opinions and observations. Tropical storms and hurricanes can be extremely dangerous. Do not think you can beat Mother Nature. Refer to an accredited weather research agency or meteorologist if you need to make serious decisions regarding an approaching storm.

User avatar
GeneratorPower
S2K Supporter
S2K Supporter
Posts: 1648
Age: 45
Joined: Sun Dec 18, 2005 11:48 pm
Location: Huntsville, AL

Re: 2021 Indicators: SST's / SAL / MSLP / Shear / Steering / Instability / Sat Images

#558 Postby GeneratorPower » Tue May 25, 2021 6:55 pm

We might want to see if some of this "cool" anomaly is due to the data set for the average temps being warmer. The Atlantic has warmed over the last 30 years, so if the reference period is the last 20 years, it might be warmer than it looks. We should look at actual temps and compare to other seasons.
4 likes   

User avatar
GrayLancer18
Tropical Depression
Tropical Depression
Posts: 88
Joined: Mon Sep 02, 2019 2:45 pm
Contact:

Re: 2021 Indicators: SST's / SAL / MSLP / Shear / Steering / Instability / Sat Images

#559 Postby GrayLancer18 » Tue May 25, 2021 10:34 pm

GeneratorPower wrote:We might want to see if some of this "cool" anomaly is due to the data set for the average temps being warmer. The Atlantic has warmed over the last 30 years, so if the reference period is the last 20 years, it might be warmer than it looks. We should look at actual temps and compare to other seasons.


I pulled these out of the NOAA Coral Reef Watch site: https://coralreefwatch.noaa.gov/product/5km/

Comparing to the past seasons up to 2017 to this very date, it has slightly cooler MDR —not as cool as 2018— and slightly cooler Gulf.

Ordered from this year to 2017:

Image

Image

Image

Image

Image
4 likes   
Hugo (1989) Hortense (1996) Georges (1998) Jeanne (2004) Irene (2011) Maria (2017)

I am NOT a professional meteorologist nor weather professional. Opinions are my own.
Consult with NHC and NOAA for official forecasts and advisories.

USTropics
Professional-Met
Professional-Met
Posts: 2649
Joined: Sun Aug 12, 2007 3:45 am
Location: Florida State University

Re: 2021 Indicators: SST's / SAL / MSLP / Shear / Steering / Instability / Sat Images

#560 Postby USTropics » Tue May 25, 2021 11:40 pm

Here are custom high-res images for May 24th for each year showing actual sea surface temperatures, dating back to 1985. Data is from NOAA's CRW v3.1 (ftp://ftp.star.nesdis.noaa.gov/pub/sod/ ... daily/sst/) and uses a custom color scale that ranges from -5C to 35C for all outputs (warning: images are quite larges, 7600x3500 to show enhanced detail, compressed are still roughly ~10mb each). First image is an animated gif for all years (37 years), individual years are included with dates in the top left of the images (starting with 2021 - 1985). I can create anomalies for these as well, with a set time frame that is inherent for each input file (such as 1985-2010 climo period). That way there is no discrepancy.

Image

Image

Image

Image

Image

Image

Image

Image

Image

Image

Image

Image

Image

Image

Image

Image

Image

Image

Image

Image

Image

Image

Image

Image

Image

Image

Image

Image

Image

Image

Image

Image

Image

Image

Image

Image

Image

Image

To get full size of images, go here - https://imgur.com/a/NN5yq73
3 likes   


Return to “Talkin' Tropics”

Who is online

Users browsing this forum: Cpv17 and 24 guests