2021 Indicators: SST's / SAL / MSLP / Shear / Steering / Instability / Sat Images

This is the general tropical discussion area. Anyone can take their shot at predicting a storms path.

Moderator: S2k Moderators

Forum rules

The posts in this forum are NOT official forecasts and should not be used as such. They are just the opinion of the poster and may or may not be backed by sound meteorological data. They are NOT endorsed by any professional institution or STORM2K. For official information, please refer to products from the National Hurricane Center and National Weather Service.

Help Support Storm2K
Message
Author
User avatar
DorkyMcDorkface
Category 3
Category 3
Posts: 819
Age: 27
Joined: Mon Sep 30, 2019 1:32 pm
Location: Mid-Atlantic

Re: 2021 Indicators: SST's / SAL / MSLP / Shear / Steering / Instability / Sat Images

#601 Postby DorkyMcDorkface » Thu Jun 03, 2021 8:36 am

Shell Mound wrote:
DorkyMcDorkface wrote:
Kingarabian wrote:June Canadian seasonal has weak La Nina for ASO:

https://i.postimg.cc/XvDXksYJ/image.png

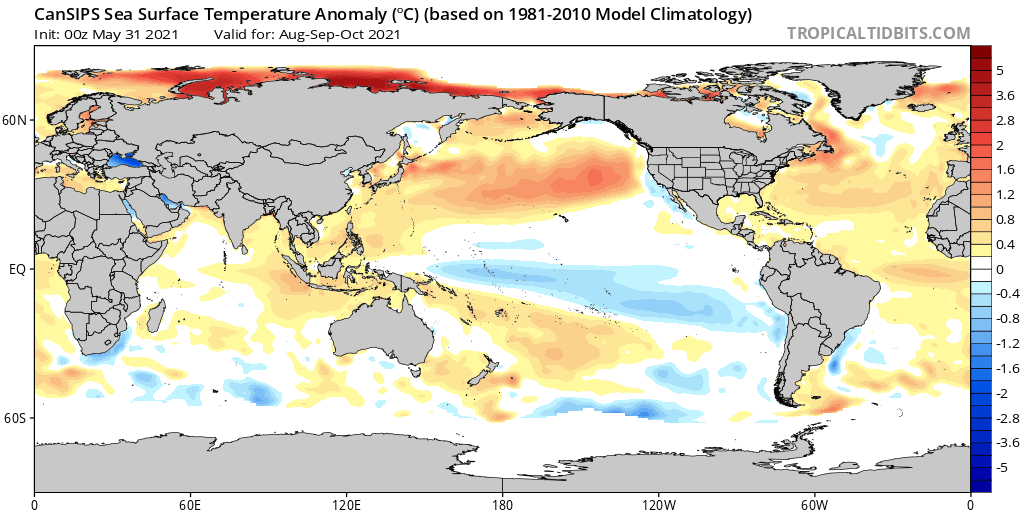
It is initializing SST anomalies @ Nino 4 and Nino 3.4 wrong though, about 0.3/0.5 degree off. It's still favoring a cooler Nino 4 and Nino 3.4 and a warmer Nino 3 and Nino 1+2. This setup has failed to materialize despite repeated model forecasts.

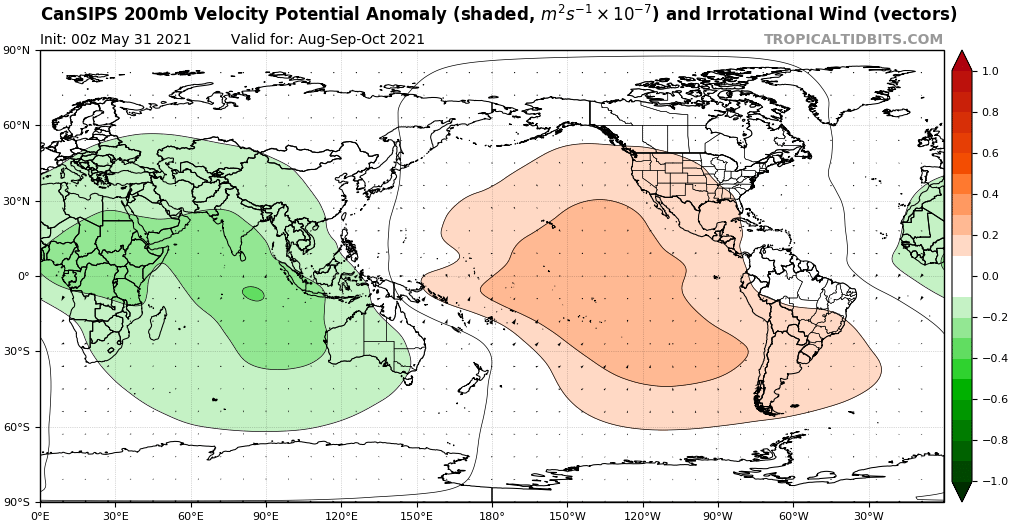
VP200 forecast favors a very active Atlantic hurricane season -- with a more favorable VP200 signature for July compared to what the 46 days EPS is currently showing.
https://i.postimg.cc/8PhHX6WD/image.png

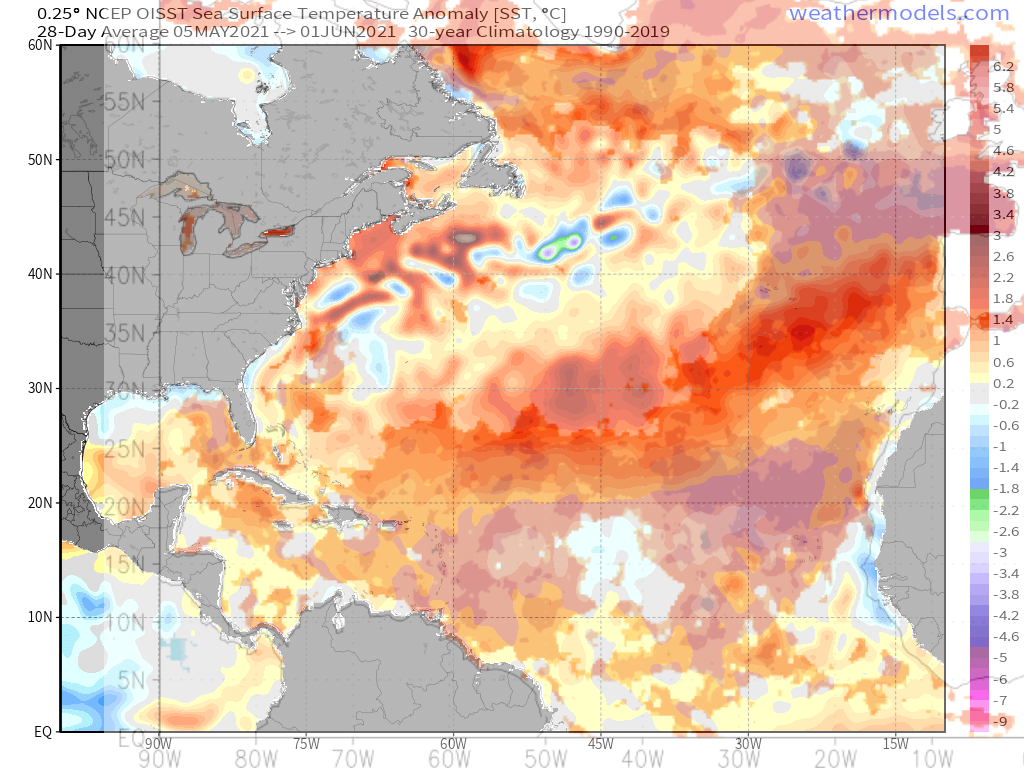
There's some mixed signals overall...while ENSO, shear and the VP configuration it is depicting are each very favorable, the overall look of the precip density isn't too impressive, which likely has to do with the mediocre SST configuration it is showing. Bit of a -AMM look with warm Gulf of Guinea combined with an almost EOF2 +AMO. Combined, this could suppress the ITCZ and enhance stability over the MDR/deep tropics à la 2019.

https://i.ibb.co/WKXLL0b/cansips-apcpna-multimonth-atl-3.png
https://i.ibb.co/WcHQthg/cansips-ssta-Mean-noice-month-atl-3.png

To what degree do these models suffer from excessive feedback? If these conditions were to occur as modelled, would the effects be as suppressive as indicated?

That I do not know. I do recall models underestimating the impact of the WAM in prior years somewhat (specifically 2018 and 2019) but at the same time that's not exactly something that can be gauged and determined with clarity, so don't trust me on that.
0 likes   
Please note the thougths expressed by this account are solely those of the user and are from a hobbyist perspective. For more comprehensive analysis, consult an actual professional meteorologist or meteorology agency.


Floyd 1999 | Isabel 2003 | Hanna 2008 | Irene 2011 | Sandy 2012 | Isaias 2020

User avatar
SFLcane
S2K Supporter
S2K Supporter
Posts: 10162
Age: 47
Joined: Sat Jun 05, 2010 1:44 pm
Location: Lake Worth Florida

Re: 2021 Indicators: SST's / SAL / MSLP / Shear / Steering / Instability / Sat Images

#602 Postby SFLcane » Thu Jun 03, 2021 9:12 am

There will be a study published today from my good friend Ryan Truchelut from Weathertiger. There seems to be some correlation with precip anomalies and Florida hurricane strikes dating back to 1900-2020. The article will be out today.
1 likes   

User avatar
toad strangler
S2K Supporter
S2K Supporter
Posts: 4543
Joined: Sun Jul 28, 2013 3:09 pm
Location: Earth
Contact:

Re: 2021 Indicators: SST's / SAL / MSLP / Shear / Steering / Instability / Sat Images

#603 Postby toad strangler » Thu Jun 03, 2021 10:04 am

SFLcane wrote:There will be a study published today from my good friend Ryan Truchelut from Weathertiger. There seems to be some correlation with precip anomalies and Florida hurricane strikes dating back to 1900-2020. The article will be out today.


You hinted at this last week IRT DRY S FL precip anomalies in this thread. While it sounds like Farmers Almanac type stuff to me I will read it and give it a shot.
5 likes   

User avatar
CourierPR
Category 5
Category 5
Posts: 1335
Age: 71
Joined: Tue Aug 31, 2004 7:53 pm
Location: Pompano Beach, Florida

Re: 2021 Indicators: SST's / SAL / MSLP / Shear / Steering / Instability / Sat Images

#604 Postby CourierPR » Thu Jun 03, 2021 12:02 pm

toad strangler wrote:
SFLcane wrote:There will be a study published today from my good friend Ryan Truchelut from Weathertiger. There seems to be some correlation with precip anomalies and Florida hurricane strikes dating back to 1900-2020. The article will be out today.


You hinted at this last week IRT DRY S FL precip anomalies in this thread. While it sounds like Farmers Almanac type stuff to me I will read it and give it a shot.


It has been said that a dry May correlates with a higher probability of a hurricane strike in Florida.
2 likes   

User avatar
NotSparta
Professional-Met
Professional-Met
Posts: 1668
Age: 23
Joined: Fri Aug 18, 2017 8:24 am
Location: Naples, FL
Contact:

Re: 2021 Indicators: SST's / SAL / MSLP / Shear / Steering / Instability / Sat Images

#605 Postby NotSparta » Thu Jun 03, 2021 2:39 pm

CourierPR wrote:
toad strangler wrote:
SFLcane wrote:There will be a study published today from my good friend Ryan Truchelut from Weathertiger. There seems to be some correlation with precip anomalies and Florida hurricane strikes dating back to 1900-2020. The article will be out today.


You hinted at this last week IRT DRY S FL precip anomalies in this thread. While it sounds like Farmers Almanac type stuff to me I will read it and give it a shot.


It has been said that a dry May correlates with a higher probability of a hurricane strike in Florida.


Apparently the years used were drier in the Miami area than last May, but it was even drier in SW Florida, not sure how much the correlation is here. Hopefully nothing hits either way
0 likes   
This post was probably an opinion of mine, and in no way is official. Please refer to http://www.hurricanes.gov for official tropical analysis and advisories.

My website, with lots of tropical wx graphics, including satellite and recon: http://cyclonicwx.com

User avatar
chaser1
S2K Supporter
S2K Supporter
Posts: 5406
Age: 64
Joined: Sat Oct 15, 2005 5:59 pm
Location: Longwood, Fl

Re: 2021 Indicators: SST's / SAL / MSLP / Shear / Steering / Instability / Sat Images

#606 Postby chaser1 » Thu Jun 03, 2021 4:54 pm

SFLcane wrote:There will be a study published today from my good friend Ryan Truchelut from Weathertiger. There seems to be some correlation with precip anomalies and Florida hurricane strikes dating back to 1900-2020. The article will be out today.


Should make for an interesting read.
0 likes   
Andy D

(For official information, please refer to the NHC and NWS products.)

Shell Mound
Category 5
Category 5
Posts: 2434
Age: 32
Joined: Thu Sep 07, 2017 3:39 pm
Location: St. Petersburg, FL → Scandinavia

Re: 2021 Indicators: SST's / SAL / MSLP / Shear / Steering / Instability / Sat Images

#607 Postby Shell Mound » Thu Jun 03, 2021 11:48 pm

chaser1 wrote:
SFLcane wrote:There will be a study published today from my good friend Ryan Truchelut from Weathertiger. There seems to be some correlation with precip anomalies and Florida hurricane strikes dating back to 1900-2020. The article will be out today.

Should make for an interesting read.

Image
Image
Image
Image
Last month, as your water bills attest, was in the driest 20% of Mays for the majority of Florida, and the absolute driest on record for some in Central and South Central Florida. ...

In South Florida’s driest 10% of Mays since 1900, a direct hurricane hit on the Southwest or Southeast Florida coast occurred later that year a little over 40% of the time, as opposed to around 20% otherwise. Of course, that 40% represents just five years out of the driest twelve since 1900, so a few random hurricane landfalls can dramatically skew perceptions. ...

The mechanism by which Lushine proposed his theory worked is that the strong high pressure keeping South Florida dry in May persists into the peak of the season and steers hurricanes towards the state. However, we ran the numbers on that idea (above), and found that anomalous high-pressure ridging in May does not predict August/September ridging between Florida and Bermuda in meaningful way.

Source
1 likes   
CVW / MiamiensisWx / Shell Mound
The posts in this forum are NOT official forecasts and should not be used as such. They are just the opinion of the poster and may or may not be backed by sound meteorological data. They are NOT endorsed by any professional institution or STORM2K. For official information, please refer to products from the NHC and NWS.

Shell Mound
Category 5
Category 5
Posts: 2434
Age: 32
Joined: Thu Sep 07, 2017 3:39 pm
Location: St. Petersburg, FL → Scandinavia

Re: 2021 Indicators: SST's / SAL / MSLP / Shear / Steering / Instability / Sat Images

#608 Postby Shell Mound » Fri Jun 04, 2021 12:17 am

Image
 https://twitter.com/curryja/status/1400508284902117377


 https://twitter.com/AndyHazelton/status/1400471751713247232


 https://twitter.com/AndyHazelton/status/1400484470885654541


Image

Note that the warmest anomalies thus far are mainly displaced from the regions that exhibit the strongest positive correlation(s) with seasonal ACE.
1 likes   
CVW / MiamiensisWx / Shell Mound
The posts in this forum are NOT official forecasts and should not be used as such. They are just the opinion of the poster and may or may not be backed by sound meteorological data. They are NOT endorsed by any professional institution or STORM2K. For official information, please refer to products from the NHC and NWS.

User avatar
Category5Kaiju
Category 5
Category 5
Posts: 4051
Joined: Thu Dec 24, 2020 12:45 pm
Location: Seattle

Re: 2021 Indicators: SST's / SAL / MSLP / Shear / Steering / Instability / Sat Images

#609 Postby Category5Kaiju » Fri Jun 04, 2021 12:49 am

https://www.myfoxhurricane.com/saharan_dust_car.html

I know it's very early June and things can change, but something that I recently noticed was the little amount of Sahara dust that is forecast to emerge off of Africa in the coming days. Like this is a huge contrast to what we saw last year at this time if I recall.
3 likes   
Unless explicitly stated, all info in my posts is based on my own opinions and observations. Tropical storms and hurricanes can be extremely dangerous. Do not think you can beat Mother Nature. Refer to an accredited weather research agency or meteorologist if you need to make serious decisions regarding an approaching storm.

Shell Mound
Category 5
Category 5
Posts: 2434
Age: 32
Joined: Thu Sep 07, 2017 3:39 pm
Location: St. Petersburg, FL → Scandinavia

Re: 2021 Indicators: SST's / SAL / MSLP / Shear / Steering / Instability / Sat Images

#610 Postby Shell Mound » Fri Jun 04, 2021 4:35 am

Category5Kaiju wrote:https://www.myfoxhurricane.com/saharan_dust_car.html

I know it's very early June and things can change, but something that I recently noticed was the little amount of Sahara dust that is forecast to emerge off of Africa in the coming days. Like this is a huge contrast to what we saw last year at this time if I recall.

If the SST profile in the Atlantic continues to reflect an -AAM signature through ASO, then a weaker African monsoon vs. last year would not help systems consolidate. Latest trends suggest that Niño 1+2 could be the warmest parts of the tropical Pacific during ASO, which would interact with the -AAM to produce El Niño-like suppressive effects over the MDR and Caribbean, shutting down homegrown activity in late September and most of October, and also result in a stronger TUTT that would weaken the subtropical ridge and decrease the threat of Cat-4+ U.S. hurricane impacts due to an inactive MDR. If this happens I only foresee an ACE of 120 at best, and my forecast for an ACE of ~190 (posted in the “numbers” thread) would bust, too. From the EPAC thread:

Kingarabian wrote:For the entire month of June, the 46 day EPS shows very weak trade wind averages over Nino 3, Nino 1+2 as well as portions of Nino 3.4 (Also westerly anomalies in the Atlantic MDR!):
https://i.imgur.com/KFDDAQ8.png

This means that there's a good chance that the EPAC SST's will be warmer for the heart of the season, as well a bit more rising motion since extended period of warm SST's eventually influences localized rising motion. This favors EPAC activity through August and maybe September At the same, trade winds will be stronger than average near the dateline and this will promote upwelling Kelvin wave(s) that in theory would reach the EPAC by August. So the status of EPAC activity in September, October, and November is up in the air. There seems to be enough OHC to raise the Nino region SST's to +0.3C/+0.4C levels. If this happens then upwelling KW activity theoretically could be offset before cool anomalies take over in October and November.

TLDR; Model forecasts currently pointing to enhanced (?) EPAC activity early September before a resurgent weak La Nina slowly winds the season down earlier than normal.

Another back-loaded season à la 2016? I think that ACE will likely be on the order of 100–120, given lukewarm SSTs + EPAC interference + warm Gulf of Guinea.
0 likes   
CVW / MiamiensisWx / Shell Mound
The posts in this forum are NOT official forecasts and should not be used as such. They are just the opinion of the poster and may or may not be backed by sound meteorological data. They are NOT endorsed by any professional institution or STORM2K. For official information, please refer to products from the NHC and NWS.

User avatar
Kingarabian
S2K Supporter
S2K Supporter
Posts: 15827
Joined: Sat Aug 08, 2009 3:06 am
Location: Honolulu, Hawaii

Re: 2021 Indicators: SST's / SAL / MSLP / Shear / Steering / Instability / Sat Images

#611 Postby Kingarabian » Fri Jun 04, 2021 5:37 am

Shell Mound wrote:
Category5Kaiju wrote:https://www.myfoxhurricane.com/saharan_dust_car.html

I know it's very early June and things can change, but something that I recently noticed was the little amount of Sahara dust that is forecast to emerge off of Africa in the coming days. Like this is a huge contrast to what we saw last year at this time if I recall.

If the SST profile in the Atlantic continues to reflect an -AAM signature through ASO, then a weaker African monsoon vs. last year would not help systems consolidate. Latest trends suggest that Niño 1+2 could be the warmest parts of the tropical Pacific during ASO, which would interact with the -AAM to produce El Niño-like suppressive effects over the MDR and Caribbean, shutting down homegrown activity in late September and most of October, and also result in a stronger TUTT that would weaken the subtropical ridge and decrease the threat of Cat-4+ U.S. hurricane impacts due to an inactive MDR. If this happens I only foresee an ACE of 120 at best, and my forecast for an ACE of ~190 (posted in the “numbers” thread) would bust, too. From the EPAC thread:

Kingarabian wrote:For the entire month of June, the 46 day EPS shows very weak trade wind averages over Nino 3, Nino 1+2 as well as portions of Nino 3.4 (Also westerly anomalies in the Atlantic MDR!):
https://i.imgur.com/KFDDAQ8.png

This means that there's a good chance that the EPAC SST's will be warmer for the heart of the season, as well a bit more rising motion since extended period of warm SST's eventually influences localized rising motion. This favors EPAC activity through August and maybe September At the same, trade winds will be stronger than average near the dateline and this will promote upwelling Kelvin wave(s) that in theory would reach the EPAC by August. So the status of EPAC activity in September, October, and November is up in the air. There seems to be enough OHC to raise the Nino region SST's to +0.3C/+0.4C levels. If this happens then upwelling KW activity theoretically could be offset before cool anomalies take over in October and November.

TLDR; Model forecasts currently pointing to enhanced (?) EPAC activity early September before a resurgent weak La Nina slowly winds the season down earlier than normal.

Another back-loaded season à la 2016? I think that ACE will likely be on the order of 100–120, given lukewarm SSTs + EPAC interference + warm Gulf of Guinea.

The Atlantic will likely be more active than 2016 though. And I seriously doubt the EPAC will be as active as 2016 which was the 5th active on record. 2016 had a +PDO to aid the EPAC. That wont be present this year.
3 likes   
RIP Kobe Bryant

User avatar
NDG
S2K Supporter
S2K Supporter
Posts: 15444
Joined: Sun Jul 09, 2006 10:14 pm
Location: Orlando, FL

Re: 2021 Indicators: SST's / SAL / MSLP / Shear / Steering / Instability / Sat Images

#612 Postby NDG » Fri Jun 04, 2021 6:33 am

Category5Kaiju wrote:https://www.myfoxhurricane.com/saharan_dust_car.html

I know it's very early June and things can change, but something that I recently noticed was the little amount of Sahara dust that is forecast to emerge off of Africa in the coming days. Like this is a huge contrast to what we saw last year at this time if I recall.


Give it a few days, it is actually kind of early for dust outbreaks, it usually gets going in the second half of June.

Image
4 likes   

User avatar
Hypercane_Kyle
Category 5
Category 5
Posts: 3344
Joined: Sat Mar 07, 2015 7:58 pm
Location: Cape Canaveral, FL

Re: 2021 Indicators: SST's / SAL / MSLP / Shear / Steering / Instability / Sat Images

#613 Postby Hypercane_Kyle » Fri Jun 04, 2021 10:09 am

NotSparta wrote:
CourierPR wrote:
toad strangler wrote:
You hinted at this last week IRT DRY S FL precip anomalies in this thread. While it sounds like Farmers Almanac type stuff to me I will read it and give it a shot.


It has been said that a dry May correlates with a higher probability of a hurricane strike in Florida.


Apparently the years used were drier in the Miami area than last May, but it was even drier in SW Florida, not sure how much the correlation is here. Hopefully nothing hits either way


I don't buy it - I recall May 2007 being very dry in Florida and there were no hurricane strikes.
1 likes   
My posts are my own personal opinion, defer to the National Hurricane Center (NHC) and other NOAA products for decision making during hurricane season.

User avatar
Category5Kaiju
Category 5
Category 5
Posts: 4051
Joined: Thu Dec 24, 2020 12:45 pm
Location: Seattle

Re: 2021 Indicators: SST's / SAL / MSLP / Shear / Steering / Instability / Sat Images

#614 Postby Category5Kaiju » Fri Jun 04, 2021 11:24 am

Hypercane_Kyle wrote:
NotSparta wrote:
CourierPR wrote:
It has been said that a dry May correlates with a higher probability of a hurricane strike in Florida.


Apparently the years used were drier in the Miami area than last May, but it was even drier in SW Florida, not sure how much the correlation is here. Hopefully nothing hits either way


I don't buy it - I recall May 2007 being very dry in Florida and there were no hurricane strikes.


2007 imho was a really weird hurricane season. There were 2 destructive Category 5 hurricanes that made landfall at such strength, yet aside from them it was basically another 2013. Perhaps one of the strongest and weakest hurricane seasons recorded all at once :D
3 likes   
Unless explicitly stated, all info in my posts is based on my own opinions and observations. Tropical storms and hurricanes can be extremely dangerous. Do not think you can beat Mother Nature. Refer to an accredited weather research agency or meteorologist if you need to make serious decisions regarding an approaching storm.

User avatar
Category5Kaiju
Category 5
Category 5
Posts: 4051
Joined: Thu Dec 24, 2020 12:45 pm
Location: Seattle

Re: 2021 Indicators: SST's / SAL / MSLP / Shear / Steering / Instability / Sat Images

#615 Postby Category5Kaiju » Fri Jun 04, 2021 1:55 pm

By the way I know people have been saying that in recent years the WAM has played a major role in warming up the Atlantic during the summer and allowing more tropical waves to be spit out and possibly lead to TCG, but out of curiosity has the WAM been very strong in active years more into the past like 1995, 1999, 2004, 2005, or 2010?
0 likes   
Unless explicitly stated, all info in my posts is based on my own opinions and observations. Tropical storms and hurricanes can be extremely dangerous. Do not think you can beat Mother Nature. Refer to an accredited weather research agency or meteorologist if you need to make serious decisions regarding an approaching storm.

Shell Mound
Category 5
Category 5
Posts: 2434
Age: 32
Joined: Thu Sep 07, 2017 3:39 pm
Location: St. Petersburg, FL → Scandinavia

Re: 2021 Indicators: SST's / SAL / MSLP / Shear / Steering / Instability / Sat Images

#616 Postby Shell Mound » Sat Jun 05, 2021 4:10 am

0 likes   
CVW / MiamiensisWx / Shell Mound
The posts in this forum are NOT official forecasts and should not be used as such. They are just the opinion of the poster and may or may not be backed by sound meteorological data. They are NOT endorsed by any professional institution or STORM2K. For official information, please refer to products from the NHC and NWS.

Shell Mound
Category 5
Category 5
Posts: 2434
Age: 32
Joined: Thu Sep 07, 2017 3:39 pm
Location: St. Petersburg, FL → Scandinavia

Re: 2021 Indicators: SST's / SAL / MSLP / Shear / Steering / Instability / Sat Images

#617 Postby Shell Mound » Sat Jun 05, 2021 4:15 am

Kingarabian wrote:
Shell Mound wrote:
Category5Kaiju wrote:https://www.myfoxhurricane.com/saharan_dust_car.html

I know it's very early June and things can change, but something that I recently noticed was the little amount of Sahara dust that is forecast to emerge off of Africa in the coming days. Like this is a huge contrast to what we saw last year at this time if I recall.

If the SST profile in the Atlantic continues to reflect an -AAM signature through ASO, then a weaker African monsoon vs. last year would not help systems consolidate. Latest trends suggest that Niño 1+2 could be the warmest parts of the tropical Pacific during ASO, which would interact with the -AAM to produce El Niño-like suppressive effects over the MDR and Caribbean, shutting down homegrown activity in late September and most of October, and also result in a stronger TUTT that would weaken the subtropical ridge and decrease the threat of Cat-4+ U.S. hurricane impacts due to an inactive MDR. If this happens I only foresee an ACE of 120 at best, and my forecast for an ACE of ~190 (posted in the “numbers” thread) would bust, too. From the EPAC thread:

Kingarabian wrote:For the entire month of June, the 46 day EPS shows very weak trade wind averages over Nino 3, Nino 1+2 as well as portions of Nino 3.4 (Also westerly anomalies in the Atlantic MDR!):
https://i.imgur.com/KFDDAQ8.png

This means that there's a good chance that the EPAC SST's will be warmer for the heart of the season, as well a bit more rising motion since extended period of warm SST's eventually influences localized rising motion. This favors EPAC activity through August and maybe September At the same, trade winds will be stronger than average near the dateline and this will promote upwelling Kelvin wave(s) that in theory would reach the EPAC by August. So the status of EPAC activity in September, October, and November is up in the air. There seems to be enough OHC to raise the Nino region SST's to +0.3C/+0.4C levels. If this happens then upwelling KW activity theoretically could be offset before cool anomalies take over in October and November.

TLDR; Model forecasts currently pointing to enhanced (?) EPAC activity early September before a resurgent weak La Nina slowly winds the season down earlier than normal.

Another back-loaded season à la 2016? I think that ACE will likely be on the order of 100–120, given lukewarm SSTs + EPAC interference + warm Gulf of Guinea.

The Atlantic will likely be more active than 2016 though. And I seriously doubt the EPAC will be as active as 2016 which was the 5th active on record. 2016 had a +PDO to aid the EPAC. That wont be present this year.

How suppressive do you think the -AAM (EOF2 +AMO) + warm Gulf of Guinea may prove to be come ASO?
0 likes   
CVW / MiamiensisWx / Shell Mound
The posts in this forum are NOT official forecasts and should not be used as such. They are just the opinion of the poster and may or may not be backed by sound meteorological data. They are NOT endorsed by any professional institution or STORM2K. For official information, please refer to products from the NHC and NWS.

User avatar
DorkyMcDorkface
Category 3
Category 3
Posts: 819
Age: 27
Joined: Mon Sep 30, 2019 1:32 pm
Location: Mid-Atlantic

Re: 2021 Indicators: SST's / SAL / MSLP / Shear / Steering / Instability / Sat Images

#618 Postby DorkyMcDorkface » Sat Jun 05, 2021 9:31 am

So the ECMWF's SEAS5 just came out and uh... :double:
Image
Image
Image
3 likes   

Please note the thougths expressed by this account are solely those of the user and are from a hobbyist perspective. For more comprehensive analysis, consult an actual professional meteorologist or meteorology agency.


Floyd 1999 | Isabel 2003 | Hanna 2008 | Irene 2011 | Sandy 2012 | Isaias 2020

User avatar
aspen
Category 5
Category 5
Posts: 8812
Joined: Sat Oct 12, 2019 7:10 pm
Location: Connecticut, USA

Re: 2021 Indicators: SST's / SAL / MSLP / Shear / Steering / Instability / Sat Images

#619 Postby aspen » Sat Jun 05, 2021 9:43 am


Yeah I’m not sure I buy the CanSIPS moisture forecast for ASON. It isn’t just dry, it seems unrealistically dry across essentially the entire tropical Atlantic from Africa to the US. Have any years compared to that moisture forecast?
1 likes   
Irene '11 Sandy '12 Hermine '16 5/15/2018 Derecho Fay '20 Isaias '20 Elsa '21 Henri '21 Ida '21

I am only a meteorology enthusiast who knows a decent amount about tropical cyclones. Look to the professional mets, the NHC, or your local weather office for the best information.

User avatar
SFLcane
S2K Supporter
S2K Supporter
Posts: 10162
Age: 47
Joined: Sat Jun 05, 2010 1:44 pm
Location: Lake Worth Florida

Re: 2021 Indicators: SST's / SAL / MSLP / Shear / Steering / Instability / Sat Images

#620 Postby SFLcane » Sat Jun 05, 2021 1:18 pm

New June Euro steering is out…Don’t look now Florida. Rather ominous :eek:

It’s dry bias though is ridiculous

Image

Image
1 likes   


Return to “Talkin' Tropics”

Who is online

Users browsing this forum: Google Adsense [Bot], Sciencerocks, Stormybajan and 99 guests