VP anomalies are a good way to determine how active a hurricane season will generally be. Anomalously warm SSTs create rising air, and rising air increases humidity and lowers wind shear. Rising air over West Africa and sinking air over the East Pacific mean an active hurricane season; sinking air over West Africa and rising air over the East Pacific mean an inactive hurricane season.
The CanSIPS model forecasts negative VP anomalies over Africa and positive VP anomalies over the Americas and the East Pacific from August to October, the peak of the Atlantic Hurricane Season; the JMA model forecasts this as well. The CFSv2 model is not included because it forecasts a VP anomaly pattern indicative of -AMO seasons, such as 1990.
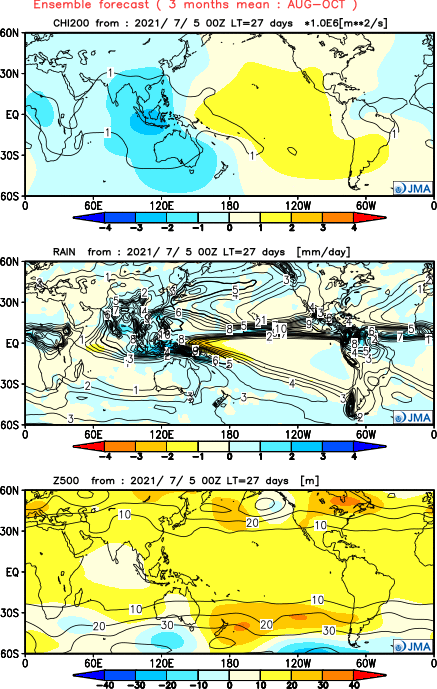
JMA forecast:
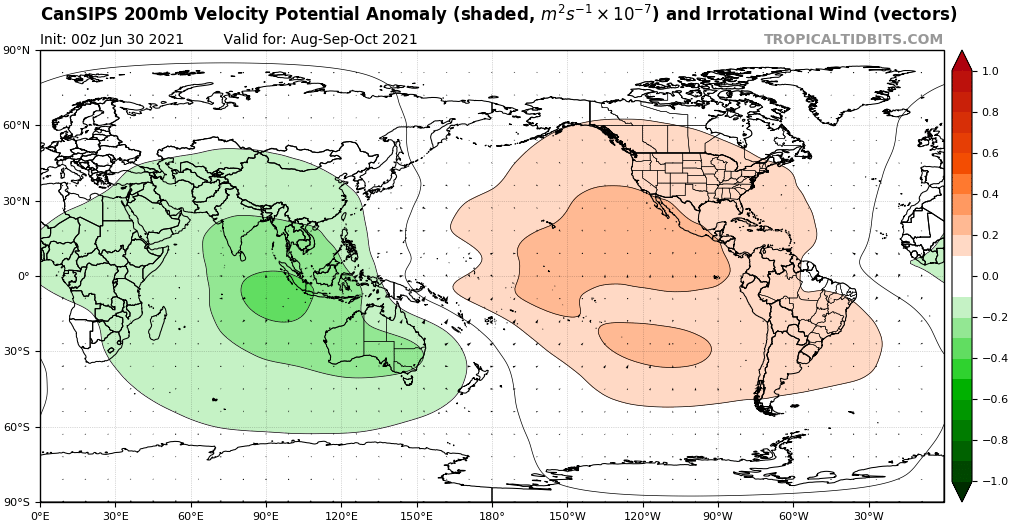
CanSIPS forecast:
To determine the favorability of each season, each season is given a favorability score, which is the VP anomaly over the East Pacific during ASO minus VP anomaly over West Africa during ASO divided by 1 million square meters per second. For example, 2020 had VP anomalies over the East Pacific of 4 million, and it had VP anomalies over West Africa of -3 million; (4 million - -3 million)/1 million = 7. 2020 is given a favorability score of 7, which is the highest favorability score of any season from 1991 to 2020. The second highest was 2010 with a score of 3, followed by 1999 with a score of 2. A spreadsheet of the data can be found
here. The general formula to calculate the expected storms of a season from the favorability score (S) is 2S + 16; for hurricanes, it is S + 8; for major hurricanes, it is S/2 + 4; for ACE, it is 25S + 160.
The biggest outliers in terms of storms, hurricanes, and major hurricanes were 2005 and 1999; the biggest outlier in terms of ACE was 2020. 2005 massively overperformed, but 2020 and 1999 massively underperformed. The margin of error for storms is 4, the margin of error for hurricanes is 2, the margin of error for major hurricanes is 1, and the margin of error of ACE is 50.
The JMA forecast calls for VP anomalies in West Africa of 2 million square meters per second below-average and VP anomalies of 2 million square meters per second above-average in the Americas and the East Pacific. This translates to a favorability score of 4. The CanSIPS forecast calls for VP anomalies in West Africa of 2 million square meters per second below-average and VP anomalies of 3 million square meters per second above-average in the Americas and the East Pacific. This translates to a favorability score of 5. Based on these forecasts, it is reasonable to assume that the favorability score will be between 2 and 5. If the favorability score were 4, that would translate to a season with 20-28 storms, 10-14 hurricanes, 5-7 major hurricanes, and 210-310 ACE. If the favorability score were 5, that would translate to a season with 22-30 storms, 11-15 hurricanes, 5-8 major hurricanes, and 235-335 ACE. This would yield 20-30 storms, 10-15 hurricanes, 5-8 major hurricanes, and 210-335 ACE. Most years, this method is fairly accurate. Last year, the storm, hurricane, and major hurricane totals were almost perfect; but the ACE total was way off.
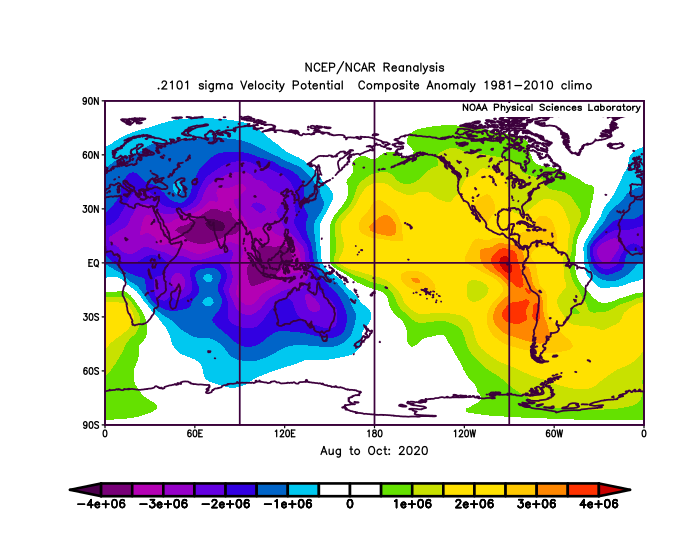
Given the VP patterns the climate models give, such a scenario is not as unreasonable as one might think. The JMA and CanSIPS are both forecasting a VP anomaly pattern very similar to the one that occurred last year. Just like the JMA and CanSIPS forecasts, the 2020 VP anomaly map showed sinking air over the Americas and the East Pacific, and it showed rising air over Africa.
2020 ASO VP anomaly map:
 TL;DR: The climate models are forecasting a VP pattern very similar to one in 2020, one with rising air over Africa and sinking air over the Americas and the East Pacific. It would yield a season with 20-30 storms, 10-15 hurricanes, 5-8 major hurricanes, and 210-335 ACE using a method that is based on the difference in VP anomalies between the East Pacific and West Africa during ASO. Those who live in hurricane-prone areas must be especially prepared for the 2021 Atlantic Hurricane Season.
The posts in this forum are NOT official forecasts and should not be used as such. They are just the opinion of the poster and may or may not be backed by sound meteorological data. They are NOT endorsed by any professional institution or
STORM2K. For official information, please refer to products from the
NHC and
NWS.


