2021 Indicators: SST's / SAL / MSLP / Shear / Steering / Instability / Sat Images

This is the general tropical discussion area. Anyone can take their shot at predicting a storms path.

Moderator: S2k Moderators

Forum rules

The posts in this forum are NOT official forecasts and should not be used as such. They are just the opinion of the poster and may or may not be backed by sound meteorological data. They are NOT endorsed by any professional institution or STORM2K. For official information, please refer to products from the National Hurricane Center and National Weather Service.

Help Support Storm2K
Message
Author
Shell Mound
Category 5
Category 5
Posts: 2434
Age: 32
Joined: Thu Sep 07, 2017 3:39 pm
Location: St. Petersburg, FL → Scandinavia

Re: 2021 Indicators: SST's / SAL / MSLP / Shear / Steering / Instability / Sat Images

#1101 Postby Shell Mound » Sun Jul 11, 2021 9:20 am

aspen wrote:
USTropics wrote:Here are some high-def images from the July NMME forecast for precipitation rates (lead time months and seasonal):

August
https://i.imgur.com/9EKwZT4.png

September
https://i.imgur.com/oKqRQQV.png

October
https://i.imgur.com/J3GHmIu.png

ASO
https://i.imgur.com/bIWd4WC.png

If those precipitation forecasts verify, then August could be a lot less favorable than I thought — lower precipitation all across most of the MDR, east coast, Caribbean, and Gulf. September and October, on the other hand, are looking better, and those maps might suggest potential in the western Caribbean.

All three have lower-latitude strips of high precipitation and might suggest lower-latitude waves and storms. If MDR SSTs still aren’t that impressive by early August, low-rider waves will be able to stick in the warmest waters before reaching the Caribbean, so we might have to watch out for more tracks like Elsa and Ivan.

The dry MDR might mean less of a risk to South(-east) Florida, however, given that most of its Category-4+ strikes (i.e., Andrew) originated in the MDR:

Image

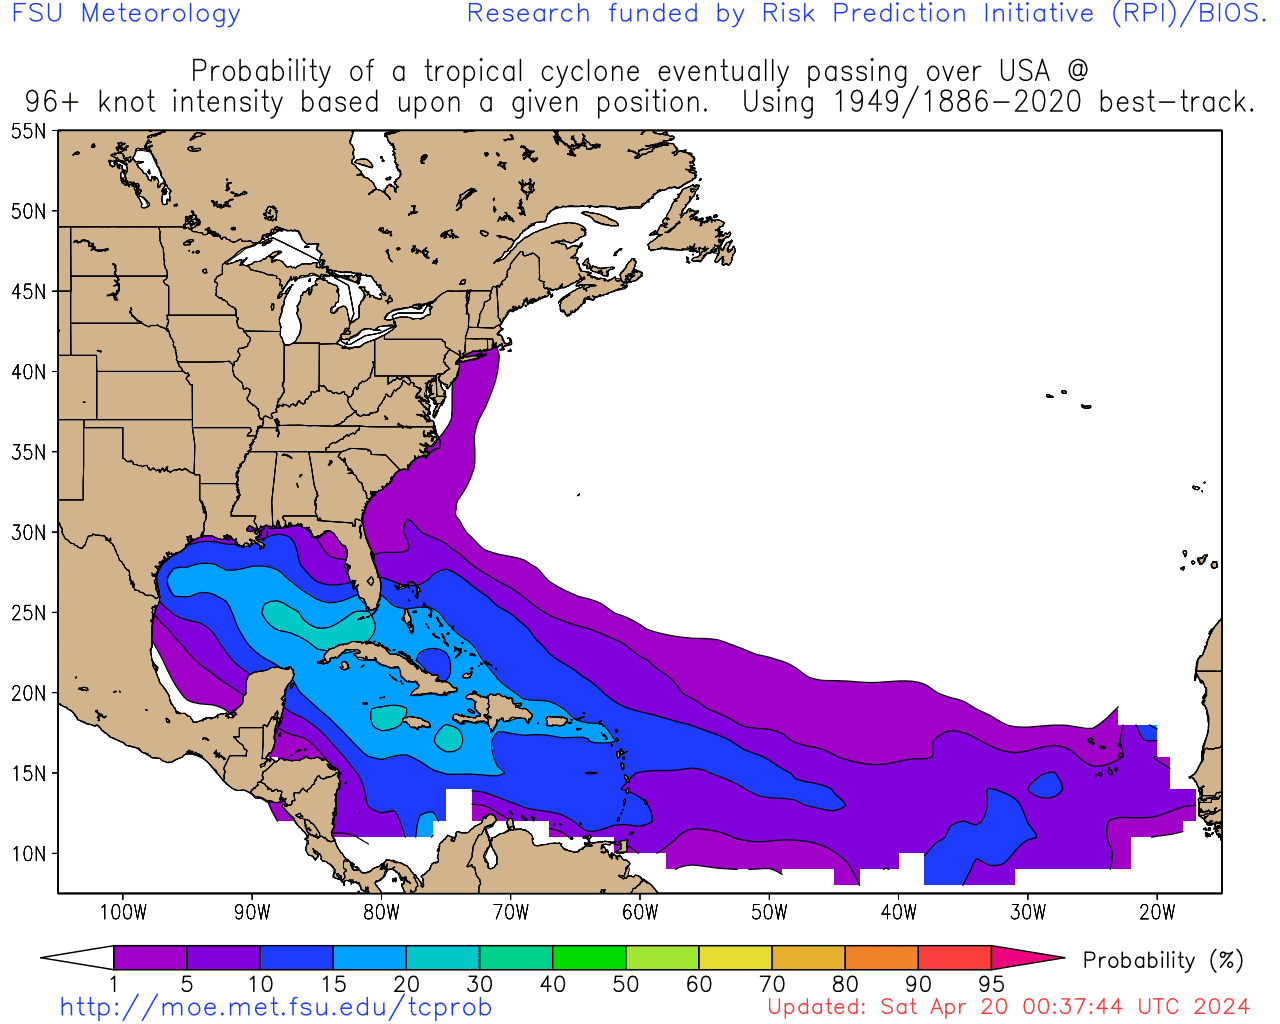
Nevertheless, the possibility of more southwesterly tracks and homegrown development in the Caribbean could imply an enhanced MH threat to the NW Gulf Coast:

Image
0 likes   
CVW / MiamiensisWx / Shell Mound
The posts in this forum are NOT official forecasts and should not be used as such. They are just the opinion of the poster and may or may not be backed by sound meteorological data. They are NOT endorsed by any professional institution or STORM2K. For official information, please refer to products from the NHC and NWS.

tolakram
Admin
Admin
Posts: 20009
Age: 62
Joined: Sun Aug 27, 2006 8:23 pm
Location: Florence, KY (name is Mark)

Re: 2021 Indicators: SST's / SAL / MSLP / Shear / Steering / Instability / Sat Images

#1102 Postby tolakram » Sun Jul 11, 2021 9:27 am

What's the typical skill level of those advance models (NMME)? I think it's pretty close to zero but I can't find any actual scoring.
1 likes   
M a r k
- - - - -
Join us in chat: Storm2K Chatroom Invite. Android and IOS apps also available.

The posts in this forum are NOT official forecasts and should not be used as such. Posts are NOT endorsed by any professional institution or STORM2K.org. For official information and forecasts, please refer to NHC and NWS products.

User avatar
SFLcane
S2K Supporter
S2K Supporter
Posts: 10163
Age: 47
Joined: Sat Jun 05, 2010 1:44 pm
Location: Lake Worth Florida

Re: 2021 Indicators: SST's / SAL / MSLP / Shear / Steering / Instability / Sat Images

#1103 Postby SFLcane » Sun Jul 11, 2021 9:30 am

So now we are using precipitation maps to determine the season? :roll:
8 likes   

Deshaunrob17
Tropical Storm
Tropical Storm
Posts: 207
Joined: Tue Aug 18, 2020 7:49 am

Re: 2021 Indicators: SST's / SAL / MSLP / Shear / Steering / Instability / Sat Images

#1104 Postby Deshaunrob17 » Sun Jul 11, 2021 9:36 am

Would not surprise me if there are more threats to the SE Caribbean this year given this pattern ...
Remembering 2004
Bonnie , Charlie, Earl and Ivan all impacted the SE Caribbean that year
1 likes   

User avatar
Category5Kaiju
Category 5
Category 5
Posts: 4097
Joined: Thu Dec 24, 2020 12:45 pm
Location: Seattle

Re: 2021 Indicators: SST's / SAL / MSLP / Shear / Steering / Instability / Sat Images

#1105 Postby Category5Kaiju » Sun Jul 11, 2021 9:45 am

SFLcane wrote:So now we are using precipitation maps to determine the season? :roll:


Yeah, idk, if one looked at the crazy wet precip anomalies forecasted in the MDR last year one would have easily thought that it would have been a very intense, MDR-hurricane season, but that did not turn out to be the case (with only Teddy being the major MDR hurricane). I wonder if the models are simply taking into consideration that with the Atlantic Nino the MDR would be shifted southward from its usual latitude or if it's an opposite-of-2020 issue where the MDR will indeed feature strong MDR hurricanes but for some reasons the models are not recognizing that. In terms of storm intensity, this is why I don't rely on precip anomalies too much. Regarding tracks, maybe a little more reliable and consistent, but I still do not think that precip anomaly maps are perfect and should be excessively followed come peak season as storms can still occur in brown areas.
1 likes   
Unless explicitly stated, all info in my posts is based on my own opinions and observations. Tropical storms and hurricanes can be extremely dangerous. Do not think you can beat Mother Nature. Refer to an accredited weather research agency or meteorologist if you need to make serious decisions regarding an approaching storm.

User avatar
chaser1
S2K Supporter
S2K Supporter
Posts: 5464
Age: 64
Joined: Sat Oct 15, 2005 5:59 pm
Location: Longwood, Fl

Re: 2021 Indicators: SST's / SAL / MSLP / Shear / Steering / Instability / Sat Images

#1106 Postby chaser1 » Sun Jul 11, 2021 12:18 pm

tolakram wrote:What's the typical skill level of those advance models (NMME)? I think it's pretty close to zero but I can't find any actual scoring.


I personally would not attempt to draw any corroborating evidence that would connect NMME forecasts to foretelling whether Tropical Cyclones will be intense overall, or where major hurricanes are likely to originate or track. Storm intensity forecasts are difficult enough several day's into the future let alone predicting weeks to months out. To be honest though, I never view an upcoming season in terms of how likely intense hurricanes are to occur. Reason being, a season of many medium to long track MDR Major hurricanes that practically all track into the mid-Atlantic may well produce a record season ACE. If all of those events were to have zero impact on population centers, then the general public at large would consider that season to have been "calm" and not impacting life and property. Even in anticipation of a strong El Nino year, I look past the prospect of a season having fewer or generally weaker hurricanes. My focus is totally on "but where might those few favorable areas exist where genesis and storm track might occur and as a result potentially impact land".

Having said that, I firmly do believe that a broad connection can be validated when viewing a post season analysis of overall storm tracks verses earlier season NMME forecasts for that season. The argument against I suppose might revolve around that NMME forecasts might be so overly broad that this may well include area's that ultimately will not feel any impacts from tropical cyclones that season. Of course there's truth to this, however I think the beneficial takeaway might simply be an early anticipation of overall storm tracks that favor a more polar or meridional motion which in term might suggest a decreased risk to the Antilles, Caribbean, or US... verses NMME forecasts that clearly would suggest a heightened risk of storm landfall that season due to projected precip forecasts depicting a pronounced zonal (east to west) flow.

When it comes right down to it, no psychic is able to accurately predict whether Houston, Miami, or Atlantic City will be impacted by a tropical cyclone that season. I do believe that ongoing data analysis & forecast tools are becoming slowly better at anticipating upcoming global patterns which ultimately control and affect regional variations of seasonal patterns. If one were to consider the potential risk analysis from a somewhat broad NMME forecast, but then consider that seasons' recent storm genesis and storm tracks, and finally.... then observe near term forecast and present day weather analysis then I think one can begin to establish an overlay that would clearly suggest regions that appear to be facing a heighten risk of tropical cyclone impact during the weeks and months to come. For the average existing home owner, all this probably won't mean much though. We all know well enough that standard storm prep and plans should be in place each hurricane season because one never knows whether the stars align and one suddenly is faced with another Hurricane Andrew. For those of us weather geeks, a greater vision into an upcoming hurricane season is quite intriguing
6 likes   
Andy D

(For official information, please refer to the NHC and NWS products.)

AlphaToOmega
Category 5
Category 5
Posts: 1448
Joined: Sat Jun 26, 2021 10:51 am
Location: Somewhere in Massachusetts

Re: 2021 Indicators: SST's / SAL / MSLP / Shear / Steering / Instability / Sat Images

#1107 Postby AlphaToOmega » Sun Jul 11, 2021 12:27 pm

VP anomalies are a good way to determine how active a hurricane season will generally be. Anomalously warm SSTs create rising air, and rising air increases humidity and lowers wind shear. Rising air over West Africa and sinking air over the East Pacific mean an active hurricane season; sinking air over West Africa and rising air over the East Pacific mean an inactive hurricane season.

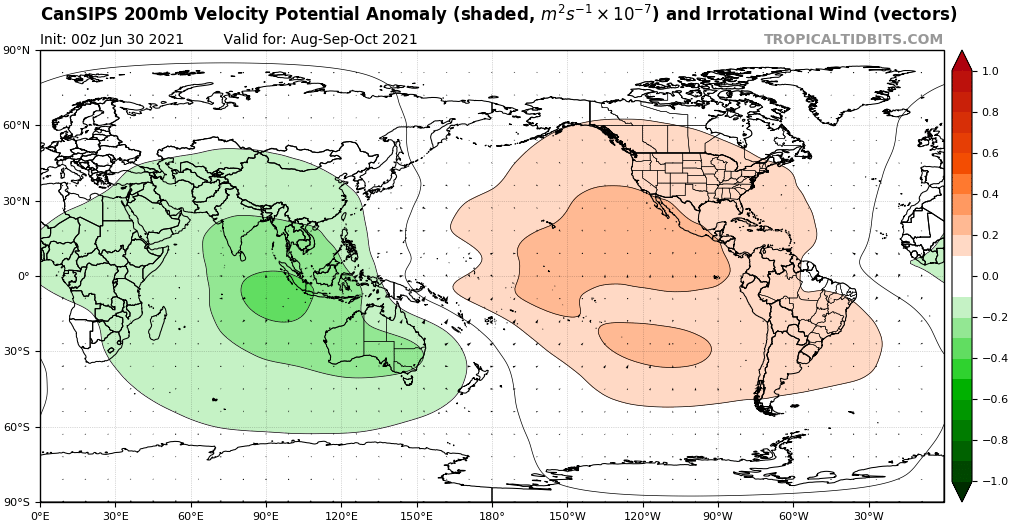
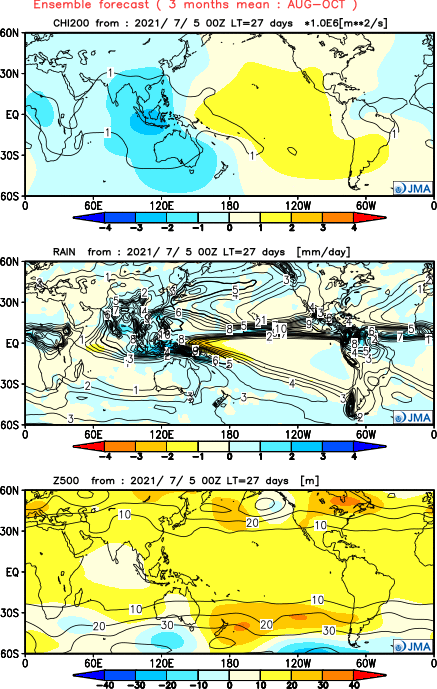
The CanSIPS model forecasts negative VP anomalies over Africa and positive VP anomalies over the Americas and the East Pacific from August to October, the peak of the Atlantic Hurricane Season; the JMA model forecasts this as well. The CFSv2 model is not included because it forecasts a VP anomaly pattern indicative of -AMO seasons, such as 1990.

JMA forecast:
Image

CanSIPS forecast:
Image

To determine the favorability of each season, each season is given a favorability score, which is the VP anomaly over the East Pacific during ASO minus VP anomaly over West Africa during ASO divided by 1 million square meters per second. For example, 2020 had VP anomalies over the East Pacific of 4 million, and it had VP anomalies over West Africa of -3 million; (4 million - -3 million)/1 million = 7. 2020 is given a favorability score of 7, which is the highest favorability score of any season from 1991 to 2020. The second highest was 2010 with a score of 3, followed by 1999 with a score of 2. A spreadsheet of the data can be found here. The general formula to calculate the expected storms of a season from the favorability score (S) is 2S + 16; for hurricanes, it is S + 8; for major hurricanes, it is S/2 + 4; for ACE, it is 25S + 160.

The biggest outliers in terms of storms, hurricanes, and major hurricanes were 2005 and 1999; the biggest outlier in terms of ACE was 2020. 2005 massively overperformed, but 2020 and 1999 massively underperformed. The margin of error for storms is 4, the margin of error for hurricanes is 2, the margin of error for major hurricanes is 1, and the margin of error of ACE is 50.

The JMA forecast calls for VP anomalies in West Africa of 2 million square meters per second below-average and VP anomalies of 2 million square meters per second above-average in the Americas and the East Pacific. This translates to a favorability score of 4. The CanSIPS forecast calls for VP anomalies in West Africa of 2 million square meters per second below-average and VP anomalies of 3 million square meters per second above-average in the Americas and the East Pacific. This translates to a favorability score of 5. Based on these forecasts, it is reasonable to assume that the favorability score will be between 2 and 5. If the favorability score were 4, that would translate to a season with 20-28 storms, 10-14 hurricanes, 5-7 major hurricanes, and 210-310 ACE. If the favorability score were 5, that would translate to a season with 22-30 storms, 11-15 hurricanes, 5-8 major hurricanes, and 235-335 ACE. This would yield 20-30 storms, 10-15 hurricanes, 5-8 major hurricanes, and 210-335 ACE. Most years, this method is fairly accurate. Last year, the storm, hurricane, and major hurricane totals were almost perfect; but the ACE total was way off.

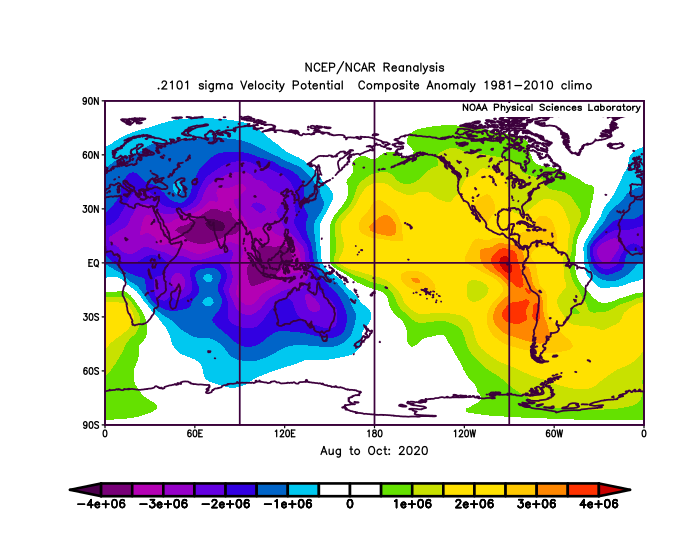
Given the VP patterns the climate models give, such a scenario is not as unreasonable as one might think. The JMA and CanSIPS are both forecasting a VP anomaly pattern very similar to the one that occurred last year. Just like the JMA and CanSIPS forecasts, the 2020 VP anomaly map showed sinking air over the Americas and the East Pacific, and it showed rising air over Africa.

2020 ASO VP anomaly map:
Image

TL;DR: The climate models are forecasting a VP pattern very similar to one in 2020, one with rising air over Africa and sinking air over the Americas and the East Pacific. It would yield a season with 20-30 storms, 10-15 hurricanes, 5-8 major hurricanes, and 210-335 ACE using a method that is based on the difference in VP anomalies between the East Pacific and West Africa during ASO. Those who live in hurricane-prone areas must be especially prepared for the 2021 Atlantic Hurricane Season.

The posts in this forum are NOT official forecasts and should not be used as such. They are just the opinion of the poster and may or may not be backed by sound meteorological data. They are NOT endorsed by any professional institution or STORM2K. For official information, please refer to products from the NHC and NWS.
7 likes   

User avatar
ScottNAtlanta
Category 5
Category 5
Posts: 2367
Joined: Sat May 25, 2013 3:11 pm
Location: Atlanta, GA

Re: 2021 Indicators: SST's / SAL / MSLP / Shear / Steering / Instability / Sat Images

#1108 Postby ScottNAtlanta » Sun Jul 11, 2021 12:31 pm

I think the anomalous 850mb westerly winds in the MDR are worth noting. They are responsible for giving low latitude storms like Elsa their spin at low latitudes. Once you get the spin going, SSTs over 26 degrees to depth are going to be sufficient to maintain decent sized storms and that will be a fairly certain condition in the entire MDR in August.
8 likes   
The posts in this forum are NOT official forecast and should not be used as such. They are just the opinion of the poster and may or may not be backed by sound meteorological data. They are NOT endorsed by any professional institution or storm2k.org. For official information, please refer to the NHC and NWS products.

User avatar
cycloneye
Admin
Admin
Posts: 145308
Age: 68
Joined: Thu Oct 10, 2002 10:54 am
Location: San Juan, Puerto Rico

Re: 2021 Indicators: SST's / SAL / MSLP / Shear / Steering / Instability / Sat Images

#1109 Postby cycloneye » Sun Jul 11, 2021 12:32 pm

0 likes   
Visit the Caribbean-Central America Weather Thread where you can find at first post web cams,radars
and observations from Caribbean basin members Click Here

User avatar
ScottNAtlanta
Category 5
Category 5
Posts: 2367
Joined: Sat May 25, 2013 3:11 pm
Location: Atlanta, GA

Re: 2021 Indicators: SST's / SAL / MSLP / Shear / Steering / Instability / Sat Images

#1110 Postby ScottNAtlanta » Sun Jul 11, 2021 12:37 pm

AlphaToOmega wrote:VP anomalies are a good way to determine how active a hurricane season will generally be. Anomalously warm SSTs create rising air, and rising air increases humidity and lowers wind shear. Rising air over West Africa and sinking air over the East Pacific mean an active hurricane season; sinking air over West Africa and rising air over the East Pacific mean an inactive hurricane season.

The CanSIPS model forecasts negative VP anomalies over Africa and positive VP anomalies over the Americas and the East Pacific from August to October, the peak of the Atlantic Hurricane Season; the JMA model forecasts this as well. The CFSv2 model is not included because it forecasts a VP anomaly pattern indicative of -AMO seasons, such as 1990.

JMA forecast:
https://i.postimg.cc/66fFhjdf/Y202107-D0500-glspr0.png

CanSIPS forecast:
https://i.postimg.cc/QtrnQ1Cz/cansips-chi200-Mean-month-global-2.png

To determine the favorability of each season, each season is given a favorability score, which is the VP anomaly over the East Pacific during ASO minus VP anomaly over West Africa during ASO divided by 1 million square meters per second. For example, 2020 had VP anomalies over the East Pacific of 4 million, and it had VP anomalies over West Africa of -3 million; (4 million - -3 million)/1 million = 7. 2020 is given a favorability score of 7, which is the highest favorability score of any season from 1991 to 2020. The second highest was 2010 with a score of 3, followed by 1999 with a score of 2. A spreadsheet of the data can be found here. The general formula to calculate the expected storms of a season from the favorability score (S) is 2S + 16; for hurricanes, it is S + 8; for major hurricanes, it is S/2 + 4; for ACE, it is 25S + 160.

The biggest outliers in terms of storms, hurricanes, and major hurricanes were 2005 and 1999; the biggest outlier in terms of ACE was 2020. 2005 massively overperformed, but 2020 and 1999 massively underperformed. The margin of error for storms is 4, the margin of error for hurricanes is 2, the margin of error for major hurricanes is 1, and the margin of error of ACE is 50.

The JMA forecast calls for VP anomalies in West Africa of 2 million square meters per second below-average and VP anomalies of 2 million square meters per second above-average in the Americas and the East Pacific. This translates to a favorability score of 4. The CanSIPS forecast calls for VP anomalies in West Africa of 2 million square meters per second below-average and VP anomalies of 3 million square meters per second above-average in the Americas and the East Pacific. This translates to a favorability score of 5. Based on these forecasts, it is reasonable to assume that the favorability score will be between 2 and 5. If the favorability score were 4, that would translate to a season with 20-28 storms, 10-14 hurricanes, 5-7 major hurricanes, and 210-310 ACE. If the favorability score were 5, that would translate to a season with 22-30 storms, 11-15 hurricanes, 5-8 major hurricanes, and 235-335 ACE. This would yield 20-30 storms, 10-15 hurricanes, 5-8 major hurricanes, and 210-335 ACE. Most years, this method is fairly accurate. Last year, the storm, hurricane, and major hurricane totals were almost perfect; but the ACE total was way off.

Given the VP patterns the climate models give, such a scenario is not as unreasonable as one might think. The JMA and CanSIPS are both forecasting a VP anomaly pattern very similar to the one that occurred last year. Just like the JMA and CanSIPS forecasts, the 2020 VP anomaly map showed sinking air over the Americas and the East Pacific, and it showed rising air over Africa.

2020 ASO VP anomaly map:
https://i.postimg.cc/BbDFxY7W/7u-Xu-J6-PUDD.png

TL;DR: The climate models are forecasting a VP pattern very similar to one in 2020, one with rising air over Africa and sinking air over the Americas and the East Pacific. It would yield a season with 20-30 storms, 10-15 hurricanes, 5-8 major hurricanes, and 210-335 ACE using a method that is based on the difference in VP anomalies between the East Pacific and West Africa during ASO. Those who live in hurricane-prone areas must be especially prepared for the 2021 Atlantic Hurricane Season.

The posts in this forum are NOT official forecasts and should not be used as such. They are just the opinion of the poster and may or may not be backed by sound meteorological data. They are NOT endorsed by any professional institution or STORM2K. For official information, please refer to products from the NHC and NWS.

The problem I have with this is that in runs counter to the fact that you have an oncoming La Nina which would imply sinking in the E. Pacific, and anomalous westerlies in the E. Atlantic which would advocate upward motion in W Africa, and all in all that sounds like an overly complicated system that has some fundamental problems.
1 likes   
The posts in this forum are NOT official forecast and should not be used as such. They are just the opinion of the poster and may or may not be backed by sound meteorological data. They are NOT endorsed by any professional institution or storm2k.org. For official information, please refer to the NHC and NWS products.

User avatar
Category5Kaiju
Category 5
Category 5
Posts: 4097
Joined: Thu Dec 24, 2020 12:45 pm
Location: Seattle

Re: 2021 Indicators: SST's / SAL / MSLP / Shear / Steering / Instability / Sat Images

#1111 Postby Category5Kaiju » Sun Jul 11, 2021 12:48 pm

Once again, while it is true that generally speaking higher ACE seasons have also tended to be high land impact seasons as well, on a more individual storm-scale level, one must ask this question: which is worse, a RI storm that accumulates 20 ACE but hits land at max strength or a powerful storm that racks up like 55 ACE but stays over open ocean?
1 likes   
Unless explicitly stated, all info in my posts is based on my own opinions and observations. Tropical storms and hurricanes can be extremely dangerous. Do not think you can beat Mother Nature. Refer to an accredited weather research agency or meteorologist if you need to make serious decisions regarding an approaching storm.

User avatar
SFLcane
S2K Supporter
S2K Supporter
Posts: 10163
Age: 47
Joined: Sat Jun 05, 2010 1:44 pm
Location: Lake Worth Florida

Re: 2021 Indicators: SST's / SAL / MSLP / Shear / Steering / Instability / Sat Images

#1112 Postby SFLcane » Sun Jul 11, 2021 1:43 pm

AlphaToOmega wrote:VP anomalies are a good way to determine how active a hurricane season will generally be. Anomalously warm SSTs create rising air, and rising air increases humidity and lowers wind shear. Rising air over West Africa and sinking air over the East Pacific mean an active hurricane season; sinking air over West Africa and rising air over the East Pacific mean an inactive hurricane season.

The CanSIPS model forecasts negative VP anomalies over Africa and positive VP anomalies over the Americas and the East Pacific from August to October, the peak of the Atlantic Hurricane Season; the JMA model forecasts this as well. The CFSv2 model is not included because it forecasts a VP anomaly pattern indicative of -AMO seasons, such as 1990.

JMA forecast:
https://i.postimg.cc/66fFhjdf/Y202107-D0500-glspr0.png

CanSIPS forecast:
https://i.postimg.cc/QtrnQ1Cz/cansips-chi200-Mean-month-global-2.png

To determine the favorability of each season, each season is given a favorability score, which is the VP anomaly over the East Pacific during ASO minus VP anomaly over West Africa during ASO divided by 1 million square meters per second. For example, 2020 had VP anomalies over the East Pacific of 4 million, and it had VP anomalies over West Africa of -3 million; (4 million - -3 million)/1 million = 7. 2020 is given a favorability score of 7, which is the highest favorability score of any season from 1991 to 2020. The second highest was 2010 with a score of 3, followed by 1999 with a score of 2. A spreadsheet of the data can be found here. The general formula to calculate the expected storms of a season from the favorability score (S) is 2S + 16; for hurricanes, it is S + 8; for major hurricanes, it is S/2 + 4; for ACE, it is 25S + 160.

The biggest outliers in terms of storms, hurricanes, and major hurricanes were 2005 and 1999; the biggest outlier in terms of ACE was 2020. 2005 massively overperformed, but 2020 and 1999 massively underperformed. The margin of error for storms is 4, the margin of error for hurricanes is 2, the margin of error for major hurricanes is 1, and the margin of error of ACE is 50.

The JMA forecast calls for VP anomalies in West Africa of 2 million square meters per second below-average and VP anomalies of 2 million square meters per second above-average in the Americas and the East Pacific. This translates to a favorability score of 4. The CanSIPS forecast calls for VP anomalies in West Africa of 2 million square meters per second below-average and VP anomalies of 3 million square meters per second above-average in the Americas and the East Pacific. This translates to a favorability score of 5. Based on these forecasts, it is reasonable to assume that the favorability score will be between 2 and 5. If the favorability score were 4, that would translate to a season with 20-28 storms, 10-14 hurricanes, 5-7 major hurricanes, and 210-310 ACE. If the favorability score were 5, that would translate to a season with 22-30 storms, 11-15 hurricanes, 5-8 major hurricanes, and 235-335 ACE. This would yield 20-30 storms, 10-15 hurricanes, 5-8 major hurricanes, and 210-335 ACE. Most years, this method is fairly accurate. Last year, the storm, hurricane, and major hurricane totals were almost perfect; but the ACE total was way off.

Given the VP patterns the climate models give, such a scenario is not as unreasonable as one might think. The JMA and CanSIPS are both forecasting a VP anomaly pattern very similar to the one that occurred last year. Just like the JMA and CanSIPS forecasts, the 2020 VP anomaly map showed sinking air over the Americas and the East Pacific, and it showed rising air over Africa.

2020 ASO VP anomaly map:
https://i.postimg.cc/BbDFxY7W/7u-Xu-J6-PUDD.png

TL;DR: The climate models are forecasting a VP pattern very similar to one in 2020, one with rising air over Africa and sinking air over the Americas and the East Pacific. It would yield a season with 20-30 storms, 10-15 hurricanes, 5-8 major hurricanes, and 210-335 ACE using a method that is based on the difference in VP anomalies between the East Pacific and West Africa during ASO. Those who live in hurricane-prone areas must be especially prepared for the 2021 Atlantic Hurricane Season.

The posts in this forum are NOT official forecasts and should not be used as such. They are just the opinion of the poster and may or may not be backed by sound meteorological data. They are NOT endorsed by any professional institution or STORM2K. For official information, please refer to products from the NHC and NWS.


Simply awesome post! :eek:
0 likes   

User avatar
SFLcane
S2K Supporter
S2K Supporter
Posts: 10163
Age: 47
Joined: Sat Jun 05, 2010 1:44 pm
Location: Lake Worth Florida

Re: 2021 Indicators: SST's / SAL / MSLP / Shear / Steering / Instability / Sat Images

#1113 Postby SFLcane » Sun Jul 11, 2021 2:06 pm

AlphaToOmega wrote:VP anomalies are a good way to determine how active a hurricane season will generally be. Anomalously warm SSTs create rising air, and rising air increases humidity and lowers wind shear. Rising air over West Africa and sinking air over the East Pacific mean an active hurricane season; sinking air over West Africa and rising air over the East Pacific mean an inactive hurricane season.

The CanSIPS model forecasts negative VP anomalies over Africa and positive VP anomalies over the Americas and the East Pacific from August to October, the peak of the Atlantic Hurricane Season; the JMA model forecasts this as well. The CFSv2 model is not included because it forecasts a VP anomaly pattern indicative of -AMO seasons, such as 1990.

JMA forecast:
https://i.postimg.cc/66fFhjdf/Y202107-D0500-glspr0.png

CanSIPS forecast:
https://i.postimg.cc/QtrnQ1Cz/cansips-chi200-Mean-month-global-2.png

To determine the favorability of each season, each season is given a favorability score, which is the VP anomaly over the East Pacific during ASO minus VP anomaly over West Africa during ASO divided by 1 million square meters per second. For example, 2020 had VP anomalies over the East Pacific of 4 million, and it had VP anomalies over West Africa of -3 million; (4 million - -3 million)/1 million = 7. 2020 is given a favorability score of 7, which is the highest favorability score of any season from 1991 to 2020. The second highest was 2010 with a score of 3, followed by 1999 with a score of 2. A spreadsheet of the data can be found here. The general formula to calculate the expected storms of a season from the favorability score (S) is 2S + 16; for hurricanes, it is S + 8; for major hurricanes, it is S/2 + 4; for ACE, it is 25S + 160.

The biggest outliers in terms of storms, hurricanes, and major hurricanes were 2005 and 1999; the biggest outlier in terms of ACE was 2020. 2005 massively overperformed, but 2020 and 1999 massively underperformed. The margin of error for storms is 4, the margin of error for hurricanes is 2, the margin of error for major hurricanes is 1, and the margin of error of ACE is 50.

The JMA forecast calls for VP anomalies in West Africa of 2 million square meters per second below-average and VP anomalies of 2 million square meters per second above-average in the Americas and the East Pacific. This translates to a favorability score of 4. The CanSIPS forecast calls for VP anomalies in West Africa of 2 million square meters per second below-average and VP anomalies of 3 million square meters per second above-average in the Americas and the East Pacific. This translates to a favorability score of 5. Based on these forecasts, it is reasonable to assume that the favorability score will be between 2 and 5. If the favorability score were 4, that would translate to a season with 20-28 storms, 10-14 hurricanes, 5-7 major hurricanes, and 210-310 ACE. If the favorability score were 5, that would translate to a season with 22-30 storms, 11-15 hurricanes, 5-8 major hurricanes, and 235-335 ACE. This would yield 20-30 storms, 10-15 hurricanes, 5-8 major hurricanes, and 210-335 ACE. Most years, this method is fairly accurate. Last year, the storm, hurricane, and major hurricane totals were almost perfect; but the ACE total was way off.

Given the VP patterns the climate models give, such a scenario is not as unreasonable as one might think. The JMA and CanSIPS are both forecasting a VP anomaly pattern very similar to the one that occurred last year. Just like the JMA and CanSIPS forecasts, the 2020 VP anomaly map showed sinking air over the Americas and the East Pacific, and it showed rising air over Africa.

2020 ASO VP anomaly map:
https://i.postimg.cc/BbDFxY7W/7u-Xu-J6-PUDD.png

TL;DR: The climate models are forecasting a VP pattern very similar to one in 2020, one with rising air over Africa and sinking air over the Americas and the East Pacific. It would yield a season with 20-30 storms, 10-15 hurricanes, 5-8 major hurricanes, and 210-335 ACE using a method that is based on the difference in VP anomalies between the East Pacific and West Africa during ASO. Those who live in hurricane-prone areas must be especially prepared for the 2021 Atlantic Hurricane Season.

The posts in this forum are NOT official forecasts and should not be used as such. They are just the opinion of the poster and may or may not be backed by sound meteorological data. They are NOT endorsed by any professional institution or STORM2K. For official information, please refer to products from the NHC and NWS.


How do you account for sst distribution?
0 likes   

User avatar
toad strangler
S2K Supporter
S2K Supporter
Posts: 4543
Joined: Sun Jul 28, 2013 3:09 pm
Location: Earth
Contact:

Re: 2021 Indicators: SST's / SAL / MSLP / Shear / Steering / Instability / Sat Images

#1114 Postby toad strangler » Sun Jul 11, 2021 2:29 pm

I think many get a skewed vision looking at the blue colors of anomaly maps LOL!. Look at actual SST's and you see it's pretty darn warm and just a hair off normal in most of the MDR. There are pro's out there talking about these supposedly cool SST's so I'm not discounting it fully but I won't be buying a seat on that bus just yet.

Image
Image
6 likes   


User avatar
Category5Kaiju
Category 5
Category 5
Posts: 4097
Joined: Thu Dec 24, 2020 12:45 pm
Location: Seattle

Re: 2021 Indicators: SST's / SAL / MSLP / Shear / Steering / Instability / Sat Images

#1116 Postby Category5Kaiju » Sun Jul 11, 2021 3:26 pm

toad strangler wrote:I think many get a skewed vision looking at the blue colors of anomaly maps LOL!. Look at actual SST's and you see it's pretty darn warm and just a hair off normal in most of the MDR. There are pro's out there talking about these supposedly cool SST's so I'm not discounting it fully but I won't be buying a seat on that bus just yet.

http://i.ibb.co/4pFQ7RD/SST2.gif
http://i.ibb.co/9Wybtc5/SST.png


Yeah I agree; in fact I could be mistaken of course but I wonder when the last year was when during peak season we had a La Nina (so an EPAC with the majority of it with cooler than average sst anomalies) but also an Atlantic with most of the basin experincing below average sst anomalies? I feel like you have to look back into the -AMO 1970s-1990s era for the last time something like this happened?
0 likes   
Unless explicitly stated, all info in my posts is based on my own opinions and observations. Tropical storms and hurricanes can be extremely dangerous. Do not think you can beat Mother Nature. Refer to an accredited weather research agency or meteorologist if you need to make serious decisions regarding an approaching storm.

Shell Mound
Category 5
Category 5
Posts: 2434
Age: 32
Joined: Thu Sep 07, 2017 3:39 pm
Location: St. Petersburg, FL → Scandinavia

Re: 2021 Indicators: SST's / SAL / MSLP / Shear / Steering / Instability / Sat Images

#1117 Postby Shell Mound » Sun Jul 11, 2021 3:51 pm


What about years that started with both Atlantic Niño and coolish MDR SSTs yet did not see a warmup into +AMM/+AMO territory come ASO?
0 likes   
CVW / MiamiensisWx / Shell Mound
The posts in this forum are NOT official forecasts and should not be used as such. They are just the opinion of the poster and may or may not be backed by sound meteorological data. They are NOT endorsed by any professional institution or STORM2K. For official information, please refer to products from the NHC and NWS.

User avatar
aspen
Category 5
Category 5
Posts: 8818
Joined: Sat Oct 12, 2019 7:10 pm
Location: Connecticut, USA

Re: 2021 Indicators: SST's / SAL / MSLP / Shear / Steering / Instability / Sat Images

#1118 Postby aspen » Sun Jul 11, 2021 3:54 pm

On the subject of cooling, according to the Coral Reef SST data on cyclonicwx, the MDR has remained relatively constant around 26.8C for the last two weeks or so; either parts of the region are cooling or are just not warming as the average temperature it’s supposed to be increases as the month progresses. However, the Caribbean actually has cooled, from just under 28.4C to 28.04C in a similar time frame. This has coincided with it going from about +0.2C warmer than average to roughly -0.2C below average. That doesn’t mean it’s too cold for TCs, as seen with Elsa.
0 likes   
Irene '11 Sandy '12 Hermine '16 5/15/2018 Derecho Fay '20 Isaias '20 Elsa '21 Henri '21 Ida '21

I am only a meteorology enthusiast who knows a decent amount about tropical cyclones. Look to the professional mets, the NHC, or your local weather office for the best information.

User avatar
cycloneye
Admin
Admin
Posts: 145308
Age: 68
Joined: Thu Oct 10, 2002 10:54 am
Location: San Juan, Puerto Rico

Re: 2021 Indicators: SST's / SAL / MSLP / Shear / Steering / Instability / Sat Images

#1119 Postby cycloneye » Sun Jul 11, 2021 5:31 pm

0 likes   
Visit the Caribbean-Central America Weather Thread where you can find at first post web cams,radars
and observations from Caribbean basin members Click Here

User avatar
Yellow Evan
Professional-Met
Professional-Met
Posts: 16143
Age: 27
Joined: Fri Jul 15, 2011 12:48 pm
Location: Henderson, Nevada/Honolulu, HI
Contact:

Re: 2021 Indicators: SST's / SAL / MSLP / Shear / Steering / Instability / Sat Images

#1120 Postby Yellow Evan » Sun Jul 11, 2021 6:18 pm

Category5Kaiju wrote:
toad strangler wrote:I think many get a skewed vision looking at the blue colors of anomaly maps LOL!. Look at actual SST's and you see it's pretty darn warm and just a hair off normal in most of the MDR. There are pro's out there talking about these supposedly cool SST's so I'm not discounting it fully but I won't be buying a seat on that bus just yet.

http://i.ibb.co/4pFQ7RD/SST2.gif
http://i.ibb.co/9Wybtc5/SST.png


Yeah I agree; in fact I could be mistaken of course but I wonder when the last year was when during peak season we had a La Nina (so an EPAC with the majority of it with cooler than average sst anomalies) but also an Atlantic with most of the basin experincing below average sst anomalies? I feel like you have to look back into the -AMO 1970s-1990s era for the last time something like this happened?


1974 is the classic season with this setup. Ofc we have an epic ASW pattern right now when the 70s had a very dry Africa so I would expect very different outcomes.
0 likes   


Return to “Talkin' Tropics”

Who is online

Users browsing this forum: Google Adsense [Bot], MEANINGLESS_NUMBERS, riapal and 45 guests