2022 Indicators (SSTs/SAL/MSLP/Shear/Steering/Instability) and >Day 16 Models
Moderator: S2k Moderators
Forum rules

The posts in this forum are NOT official forecasts and should not be used as such. They are just the opinion of the poster and may or may not be backed by sound meteorological data. They are NOT endorsed by any professional institution or STORM2K. For official information, please refer to products from the National Hurricane Center and National Weather Service.
-
AtlanticWind
- S2K Supporter

- Posts: 1898
- Age: 67
- Joined: Sun Aug 08, 2004 9:57 pm
- Location: Plantation,Fla
Re: 2022 Indicators (SSTs/SAL/MSLP/Shear/Steering/Instability) and >Day 16 Models
If storm 2k allowed betting on the website, I think I could make a lot of money in July 
11 likes
-
weeniepatrol

- Category 5

- Posts: 1342
- Joined: Sat Aug 22, 2020 5:30 pm
- Location: WA State
Re: 2022 Indicators (SSTs/SAL/MSLP/Shear/Steering/Instability) and >Day 16 Models
AtlanticWind wrote:If storm 2k allowed betting on the website, I think I could make a lot of money in July
buy low, sell high! get your $MDR calls while they're cheap
5 likes

Re: 2022 Indicators (SSTs/SAL/MSLP/Shear/Steering/Instability) and >Day 16 Models
Seeing how frequently 1995, 96, 98, 99 appear in analog years for this year got me thinking:
While it's impressive to have 4 out of 5 seasons during 1995-99 hitting hyperactive ACE, most of their September storms are classic recurving MDR storms that either go OTS or scrape the NE Caribbean and/or the Carolinas, with Georges and perhaps Fran being the only exceptions. In other words, they're the ideal type of storms for generating ACE. In contrast, early indicators for 2022 suggest a Caribbean-heavy season with strong ridging.
I know ridge forecasts are tricky, but my point is: Is the difference between hyperactive ACE (>159.6) and high-end above-average ACE more based on luck and steering? A season like 2008 could have easily become officially hyperactive if it wasn't so west-based. 2020 would have also ended up with "merely" above-average ACE if Eta and Iota didn't form.
3 likes
TC naming lists: retirements and intensity
Most aggressive Advisory #1's in North Atlantic (cr. kevin for starting the list)
Most aggressive Advisory #1's in North Atlantic (cr. kevin for starting the list)
-
Category5Kaiju

- Category 5
- Posts: 4331
- Joined: Thu Dec 24, 2020 12:45 pm
- Location: Seattle and Phoenix
Re: 2022 Indicators (SSTs/SAL/MSLP/Shear/Steering/Instability) and >Day 16 Models
Teban54 wrote:Seeing how frequently 1995, 96, 98, 99 appear in analog years for this year got me thinking:
While it's impressive to have 4 out of 5 seasons during 1995-99 hitting hyperactive ACE, most of their September storms are classic recurving MDR storms that either go OTS or scrape the NE Caribbean and/or the Carolinas, with Georges and perhaps Fran being the only exceptions. In other words, they're the ideal type of storms for generating ACE. In contrast, early indicators for 2022 suggest a Caribbean-heavy season with strong ridging.
I know ridge forecasts are tricky, but my point is: Is the difference between hyperactive ACE (>159.6) and high-end above-average ACE more based on luck and steering? A season like 2008 could have easily become officially hyperactive if it wasn't so west-based. 2020 would have also ended up with "merely" above-average ACE if Eta and Iota didn't form.
2008 is arguably the most memorable and scariest non-hyperactive year we've had in recent times. It is also the only recorded hurricane season that was operationally not a hyperactive year but featured at least 5 major hurricanes. 2008 had several notable beasts (Gustav, Ike, and Paloma), but I can guarantee you that if any of those storms were stronger and longer lasting (maybe take Ike for instance; like if Ike was a Cat 5 storm at its peak instead), then 2008 could have easily gone hyperactive.
4 likes
Unless explicitly stated, all info in my posts is based on my own opinions and observations. Tropical storms and hurricanes can be extremely dangerous. Refer to an accredited weather research agency or meteorologist if you need to make serious decisions regarding an approaching storm.
-
Deshaunrob17
- Tropical Storm

- Posts: 211
- Joined: Tue Aug 18, 2020 7:49 am
Re: 2022 Indicators (SSTs/SAL/MSLP/Shear/Steering/Instability) and >Day 16 Models
Teban54 wrote:Seeing how frequently 1995, 96, 98, 99 appear in analog years for this year got me thinking:
While it's impressive to have 4 out of 5 seasons during 1995-99 hitting hyperactive ACE, most of their September storms are classic recurving MDR storms that either go OTS or scrape the NE Caribbean and/or the Carolinas, with Georges and perhaps Fran being the only exceptions. In other words, they're the ideal type of storms for generating ACE. In contrast, early indicators for 2022 suggest a Caribbean-heavy season with strong ridging.
I know ridge forecasts are tricky, but my point is: Is the difference between hyperactive ACE (>159.6) and high-end above-average ACE more based on luck and steering? A season like 2008 could have easily become officially hyperactive if it wasn't so west-based. 2020 would have also ended up with "merely" above-average ACE if Eta and Iota didn't form.
You’re right!! Too much of a west based season reduced Ace because of land interaction and lack of time!!!! However, I feel like there is a fine lining because too much OTS prevents storms from reaching their max potential due to less ocean heat content, cooler SSTs, dry air and sometimes shear (2010 for example) …
I feel like the seasons where MDR storms are directed to the NE Caribbean and curve away from continental US tend to have to greatest ACE
However seasons where MDR storms track into the Caribbean can produce high Ace if atmospheric conditions are there.
5 likes
-
Category5Kaiju
- Category 5
- Posts: 4331
- Joined: Thu Dec 24, 2020 12:45 pm
- Location: Seattle and Phoenix
Re: 2022 Indicators (SSTs/SAL/MSLP/Shear/Steering/Instability) and >Day 16 Models
So I just stumbled across this, but apparently 2017 had a similar sst anomaly profile that we have now, with a rather cool subtropics and lack of a pronounced +AMO horseshoe by around the similar time of the year.
While yes it is true that 2017's MDR warmth is much greater than 2022, I don't personally think that that cool subtropical pool and a lack of a strong Canary Current by this time in late July is necessarily as huge of a detriment to a season's potential as some are suggesting. If years like 1996, 1998, or 1999 could exceed 2013 in activity despite starting off with cooler MDR sst anomalies, and if a year like 2010 with dragon fire-like warmth in the MDR was exceeded by a year like 2017 with cooler MDR sst anomalies...this just shows you how upper-level conditions such as shear and dry air are arguably more important than sst anomalies, and sst anomalies tell just a part of the story.
12 likes
Unless explicitly stated, all info in my posts is based on my own opinions and observations. Tropical storms and hurricanes can be extremely dangerous. Refer to an accredited weather research agency or meteorologist if you need to make serious decisions regarding an approaching storm.
-
captainbarbossa19

- Professional-Met

- Posts: 1094
- Age: 27
- Joined: Wed Aug 21, 2019 11:09 pm
- Location: Beaumont, TX
Re: 2022 Indicators (SSTs/SAL/MSLP/Shear/Steering/Instability) and >Day 16 Models
Category5Kaiju wrote:https://www.ospo.noaa.gov/data/sst/anomaly/2017/anomnight.7.27.2017.gif
So I just stumbled across this, but apparently 2017 had a similar sst anomaly profile that we have now, with a rather cool subtropics and lack of a pronounced +AMO horseshoe by around the similar time of the year.
While yes it is true that 2017's MDR warmth is much greater than 2022, I don't personally think that that cool subtropical pool and a lack of a strong Canary Current by this time in late July is necessarily as huge of a detriment to a season's potential as some are suggesting. If years like 1996, 1998, or 1999 could exceed 2013 in activity despite starting off with cooler MDR sst anomalies, and if a year like 2010 with dragon fire-like warmth in the MDR was exceeded by a year like 2017 with cooler MDR sst anomalies...this just shows you how upper-level conditions such as shear and dry air are arguably more important than sst anomalies, and sst anomalies tell just a part of the story.
Really it doesn't look that much different on the Atlantic side. This image is also 5km instead of 50.

1 likes
-
NotSparta

- Professional-Met
- Posts: 1677
- Age: 24
- Joined: Fri Aug 18, 2017 8:24 am
- Location: Naples, FL
- Contact:
Re: 2022 Indicators (SSTs/SAL/MSLP/Shear/Steering/Instability) and >Day 16 Models
captainbarbossa19 wrote:Category5Kaiju wrote:https://www.ospo.noaa.gov/data/sst/anomaly/2017/anomnight.7.27.2017.gif
So I just stumbled across this, but apparently 2017 had a similar sst anomaly profile that we have now, with a rather cool subtropics and lack of a pronounced +AMO horseshoe by around the similar time of the year.
While yes it is true that 2017's MDR warmth is much greater than 2022, I don't personally think that that cool subtropical pool and a lack of a strong Canary Current by this time in late July is necessarily as huge of a detriment to a season's potential as some are suggesting. If years like 1996, 1998, or 1999 could exceed 2013 in activity despite starting off with cooler MDR sst anomalies, and if a year like 2010 with dragon fire-like warmth in the MDR was exceeded by a year like 2017 with cooler MDR sst anomalies...this just shows you how upper-level conditions such as shear and dry air are arguably more important than sst anomalies, and sst anomalies tell just a part of the story.
Really it doesn't look that much different on the Atlantic side. This image is also 5km instead of 50.
https://i.imgur.com/cyqmVDX.png
Here's a comparison of the two. Atlantic a little cooler overall at the lower latitudes

7 likes
This post was probably an opinion of mine, and in no way is official. Please refer to http://www.hurricanes.gov for official tropical analysis and advisories.
My website, with lots of tropical wx graphics, including satellite and recon: http://cyclonicwx.com
My website, with lots of tropical wx graphics, including satellite and recon: http://cyclonicwx.com

Re: 2022 Indicators (SSTs/SAL/MSLP/Shear/Steering/Instability) and >Day 16 Models
NotSparta wrote:captainbarbossa19 wrote:Category5Kaiju wrote:https://www.ospo.noaa.gov/data/sst/anomaly/2017/anomnight.7.27.2017.gif
So I just stumbled across this, but apparently 2017 had a similar sst anomaly profile that we have now, with a rather cool subtropics and lack of a pronounced +AMO horseshoe by around the similar time of the year.
While yes it is true that 2017's MDR warmth is much greater than 2022, I don't personally think that that cool subtropical pool and a lack of a strong Canary Current by this time in late July is necessarily as huge of a detriment to a season's potential as some are suggesting. If years like 1996, 1998, or 1999 could exceed 2013 in activity despite starting off with cooler MDR sst anomalies, and if a year like 2010 with dragon fire-like warmth in the MDR was exceeded by a year like 2017 with cooler MDR sst anomalies...this just shows you how upper-level conditions such as shear and dry air are arguably more important than sst anomalies, and sst anomalies tell just a part of the story.
Really it doesn't look that much different on the Atlantic side. This image is also 5km instead of 50.
https://i.imgur.com/cyqmVDX.png
Here's a comparison of the two. Atlantic a little cooler overall at the lower latitudes
https://media.discordapp.net/attachments/661421636003823632/1001195791223881809/crw_compare.gif
What’s remarkable about the 2022 SSTA map is that massive warm blob south of Alaska. I’d imagine something of that magnitude would have some impact on weather patterns. I don’t think it’s in the exact same position, but it reminds me of The Blob from the mid 2010s. Did The Blob coincide with the 2014-16 Niño and the 2014-18 EPac active steak?
0 likes
Irene '11 Sandy '12 Hermine '16 5/15/2018 Derecho Fay '20 Isaias '20 Elsa '21 Henri '21 Ida '21
I am only a meteorology enthusiast who knows a decent amount about tropical cyclones. Look to the professional mets, the NHC, or your local weather office for the best information.
I am only a meteorology enthusiast who knows a decent amount about tropical cyclones. Look to the professional mets, the NHC, or your local weather office for the best information.
-
NotSparta
- Professional-Met
- Posts: 1677
- Age: 24
- Joined: Fri Aug 18, 2017 8:24 am
- Location: Naples, FL
- Contact:
Re: 2022 Indicators (SSTs/SAL/MSLP/Shear/Steering/Instability) and >Day 16 Models
aspen wrote:NotSparta wrote:captainbarbossa19 wrote:
Really it doesn't look that much different on the Atlantic side. This image is also 5km instead of 50.
https://i.imgur.com/cyqmVDX.png
Here's a comparison of the two. Atlantic a little cooler overall at the lower latitudes
https://media.discordapp.net/attachments/661421636003823632/1001195791223881809/crw_compare.gif
What’s remarkable about the 2022 SSTA map is that massive warm blob south of Alaska. I’d imagine something of that magnitude would have some impact on weather patterns. I don’t think it’s in the exact same position, but it reminds me of The Blob from the mid 2010s. Did The Blob coincide with the 2014-16 Niño and the 2014-18 EPac active steak?
It did, but back then I believe it was further east. It reinforced the +PDO then but right now that warm blob is a sign that -PDO persists
2 likes
This post was probably an opinion of mine, and in no way is official. Please refer to http://www.hurricanes.gov for official tropical analysis and advisories.
My website, with lots of tropical wx graphics, including satellite and recon: http://cyclonicwx.com
My website, with lots of tropical wx graphics, including satellite and recon: http://cyclonicwx.com
-
cycloneye

- Admin

- Posts: 149291
- Age: 69
- Joined: Thu Oct 10, 2002 10:54 am
- Location: San Juan, Puerto Rico
Re: 2022 Indicators (SSTs/SAL/MSLP/Shear/Steering/Instability) and >Day 16 Models
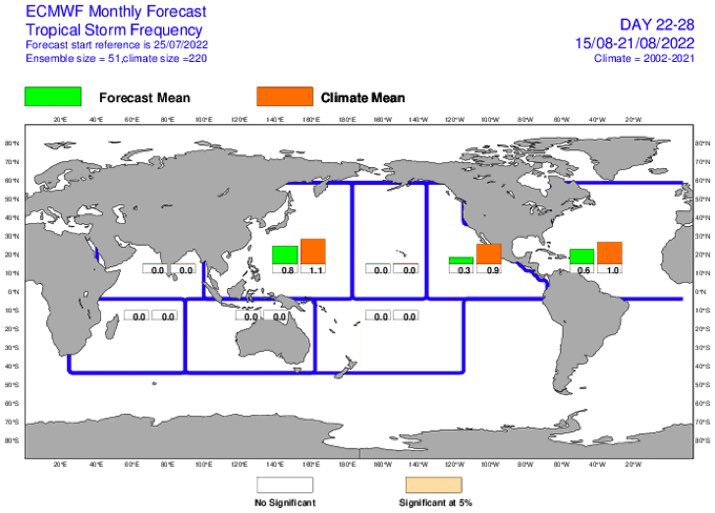
Let's see if this can rise the mood here. Here are the EPS weeklies from August 15th thru the 20th when activity picks up.

4 likes
Visit the Caribbean-Central America Weather Thread where you can find at first post web cams,radars
and observations from Caribbean basin members Click Here
and observations from Caribbean basin members Click Here
-
captainbarbossa19
- Professional-Met
- Posts: 1094
- Age: 27
- Joined: Wed Aug 21, 2019 11:09 pm
- Location: Beaumont, TX
Re: 2022 Indicators (SSTs/SAL/MSLP/Shear/Steering/Instability) and >Day 16 Models
cycloneye wrote:Let's see if this can rise the mood here. Here are the EPS weeklies from August 15th thru the 20th when activity picks up.
https://i.imgur.com/nxeMrn2.png
The two maxima on the map are interesting. It almost looks like the waves might be moving off further north, but bending WSW. I am wondering if that could be indicative of a strong ridge?
0 likes
-
skyline385

- Category 5
- Posts: 2728
- Age: 35
- Joined: Wed Aug 26, 2020 11:15 pm
- Location: Houston TX
2022 Indicators (SSTs/SAL/MSLP/Shear/Steering/Instability) and >Day 16 Models
cycloneye wrote:Let's see if this can rise the mood here. Here are the EPS weeklies from August 15th thru the 20th when activity picks up.
Caribbean activity picking up in last week of August and September first week.

Another interesting feature from todays weeklies was how dry the east coast of Florida is

Last edited by skyline385 on Mon Jul 25, 2022 4:24 pm, edited 1 time in total.
0 likes
-
Spacecoast

- Category 2

- Posts: 773
- Joined: Thu Aug 31, 2017 2:03 pm
Re: 2022 Indicators (SSTs/SAL/MSLP/Shear/Steering/Instability) and >Day 16 Models
cycloneye wrote:Let's see if this can rise the mood here. Here are the EPS weeklies from August 15th thru the 20th when activity picks up.
Climotology for same period....

3 likes
-
SFLcane

- S2K Supporter
- Posts: 10281
- Age: 48
- Joined: Sat Jun 05, 2010 1:44 pm
- Location: Lake Worth Florida
Re: 2022 Indicators (SSTs/SAL/MSLP/Shear/Steering/Instability) and >Day 16 Models
cycloneye wrote:Let's see if this can rise the mood here. Here are the EPS weeklies from August 15th thru the 20th when activity picks up.
https://i.imgur.com/nxeMrn2.png
TS frequency is below climo lol.
3 likes
Re: 2022 Indicators (SSTs/SAL/MSLP/Shear/Steering/Instability) and >Day 16 Models
SFLcane wrote:cycloneye wrote:Let's see if this can rise the mood here. Here are the EPS weeklies from August 15th thru the 20th when activity picks up.
https://i.imgur.com/nxeMrn2.png
TS frequency is below climo lol.
https://i.postimg.cc/Bb9CCnPz/3-B4899-B5-1233-450-D-923-C-1552-EC65301-A.jpg
Looks like the EPac has finally shut off by mid-August on the Euro.
0 likes
Irene '11 Sandy '12 Hermine '16 5/15/2018 Derecho Fay '20 Isaias '20 Elsa '21 Henri '21 Ida '21
I am only a meteorology enthusiast who knows a decent amount about tropical cyclones. Look to the professional mets, the NHC, or your local weather office for the best information.
I am only a meteorology enthusiast who knows a decent amount about tropical cyclones. Look to the professional mets, the NHC, or your local weather office for the best information.

Re: 2022 Indicators (SSTs/SAL/MSLP/Shear/Steering/Instability) and >Day 16 Models
cycloneye wrote:Let's see if this can rise the mood here. Here are the EPS weeklies from August 15th thru the 20th when activity picks up.
https://i.imgur.com/nxeMrn2.png
This is a matter of perspective. If you like tropical systems, I don't think this images is picking up any moods.
2 likes
Personal Forecast Disclaimer:
The posts in this forum are NOT official forecast and should not be used as such. They are just the opinion of the poster and may or may not be backed by sound meteorological data. They are NOT endorsed by any professional institution or storm2k.org. For official information, please refer to the NHC and NWS products.
The posts in this forum are NOT official forecast and should not be used as such. They are just the opinion of the poster and may or may not be backed by sound meteorological data. They are NOT endorsed by any professional institution or storm2k.org. For official information, please refer to the NHC and NWS products.
-
Category5Kaiju
- Category 5
- Posts: 4331
- Joined: Thu Dec 24, 2020 12:45 pm
- Location: Seattle and Phoenix
Re: 2022 Indicators (SSTs/SAL/MSLP/Shear/Steering/Instability) and >Day 16 Models
SFLcane wrote:cycloneye wrote:Let's see if this can rise the mood here. Here are the EPS weeklies from August 15th thru the 20th when activity picks up.
https://i.imgur.com/nxeMrn2.png
TS frequency is below climo lol.
https://i.postimg.cc/Bb9CCnPz/3-B4899-B5-1233-450-D-923-C-1552-EC65301-A.jpg
It's below average in the WPAC and EPAC too tho
0 likes
Unless explicitly stated, all info in my posts is based on my own opinions and observations. Tropical storms and hurricanes can be extremely dangerous. Refer to an accredited weather research agency or meteorologist if you need to make serious decisions regarding an approaching storm.

Re: 2022 Indicators (SSTs/SAL/MSLP/Shear/Steering/Instability) and >Day 16 Models
African waves still have the SAL to deal with.
http://tropic.ssec.wisc.edu/real-time/s ... split.html
http://tropic.ssec.wisc.edu/real-time/s ... split.html
0 likes
-
weeniepatrol
- Category 5
- Posts: 1342
- Joined: Sat Aug 22, 2020 5:30 pm
- Location: WA State
Re: 2022 Indicators (SSTs/SAL/MSLP/Shear/Steering/Instability) and >Day 16 Models
Probably still just a tad too early, but there is this

5 likes
Who is online
Users browsing this forum: No registered users and 114 guests