Don't understand it fully? It took me a while to fully understand soundings when I was in college. I took a job in the school weather station as a map plotter (no computers then). I volunteered to plot all the Skew-T soundings for the upper-level classes. Got quite familiar with them.
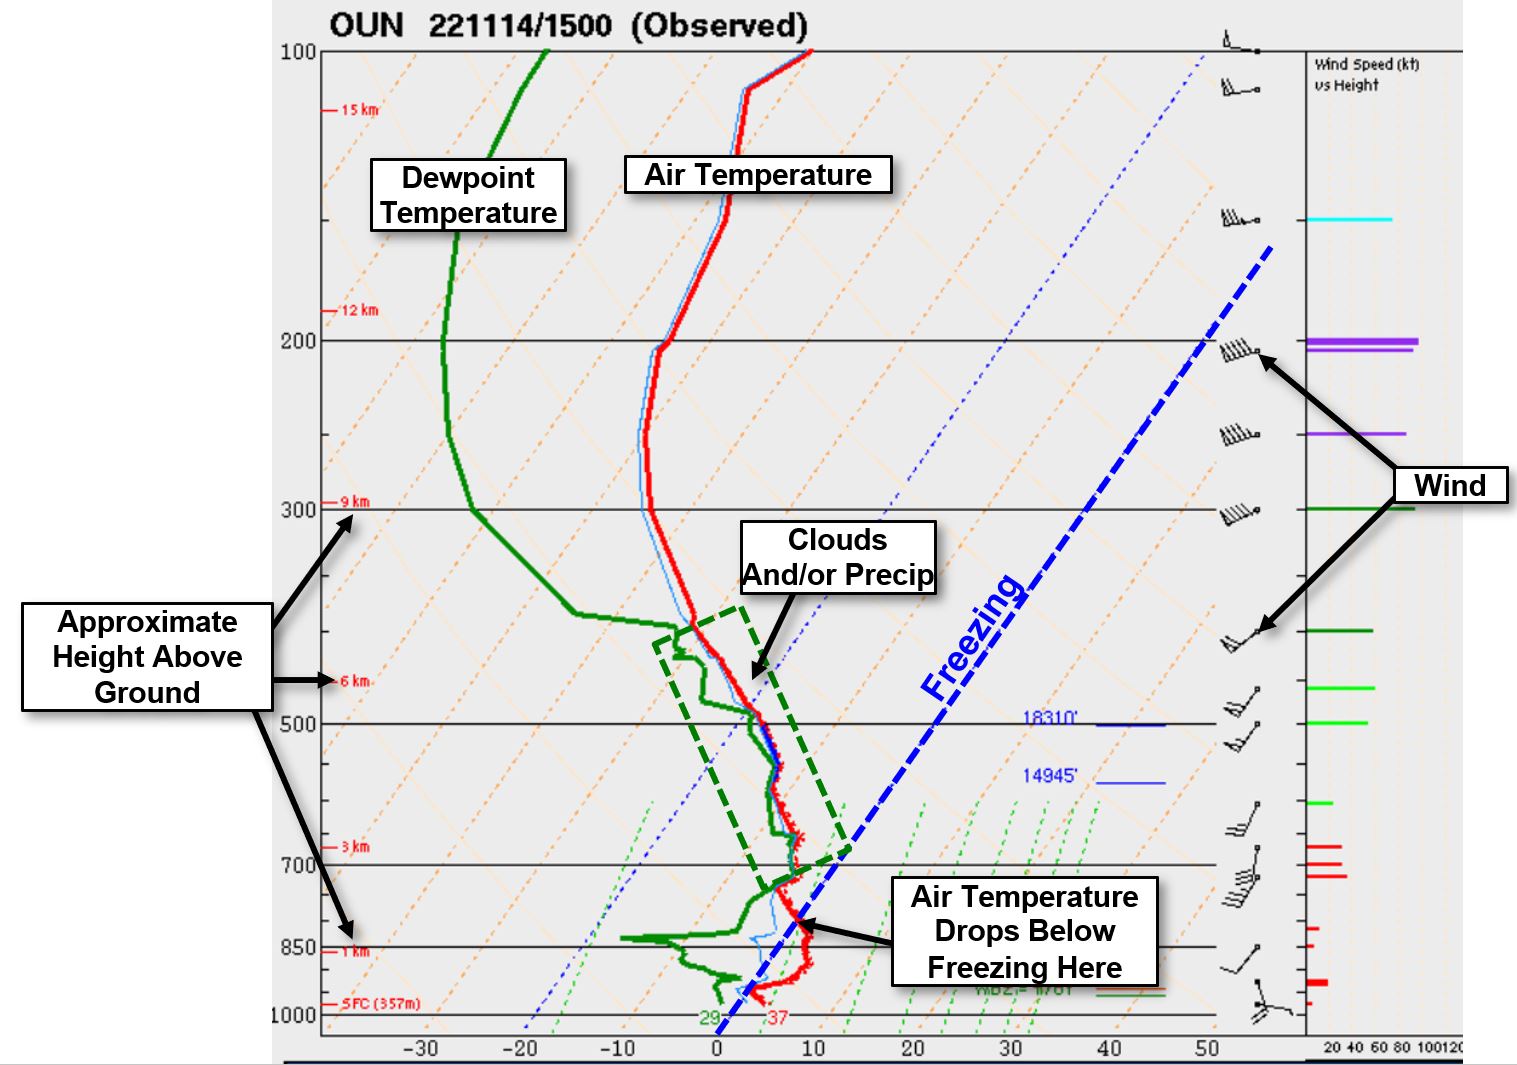
Let me give you a rundown. The chart is situated such that the ground is at the bottom and the top of the troposphere is at the top. Temperature runs along the horizontal scale. The temperature lines go up diagonally toward the upper right. I highlighted the freezing line in blue. Note that the red temperature line is to the right (warmer) of the freezing line until it gets up to just above the 850mb horizontal line. That's about 6000 ft above the ground. That says that the air temperature is above freezing up to about 6000 ft. Also note a very tiny area where that red line nearly touches freezing just above the bottom (surface). At that point, the red and green lines are close together, indicating a low cloud deck. From about 700mb up to about 400mb, the red and green lines are touching (or within 5C) of each other. This indicates clouds and probably the precipitation layer. That whole layer is to the left of the freezing line, so it's likely snow falling.
However, the snow reaches the point where the red line (temp) is right of the freezing line and starts to melt. From that high up, it would fall as liquid (rain). The snow wouldn't survive a fall of 6000 ft with air temps into the 40s. Remember that tiny area near the surface where the red temperature line is just touching the blue dashed freezing line? That means that the rain might pass through a very shallow layer of freezing air just above the ground. If that air is actually below freezing for a bit, then that rain may re-freeze into sleet.
Now, you're an expert.

P.S. That sounding was for 9am Central. The atmosphere is constantly changing. I see you're reporting snow 3 1/2 hours after that sounding, telling me the air overhead has cooled since 9am.