


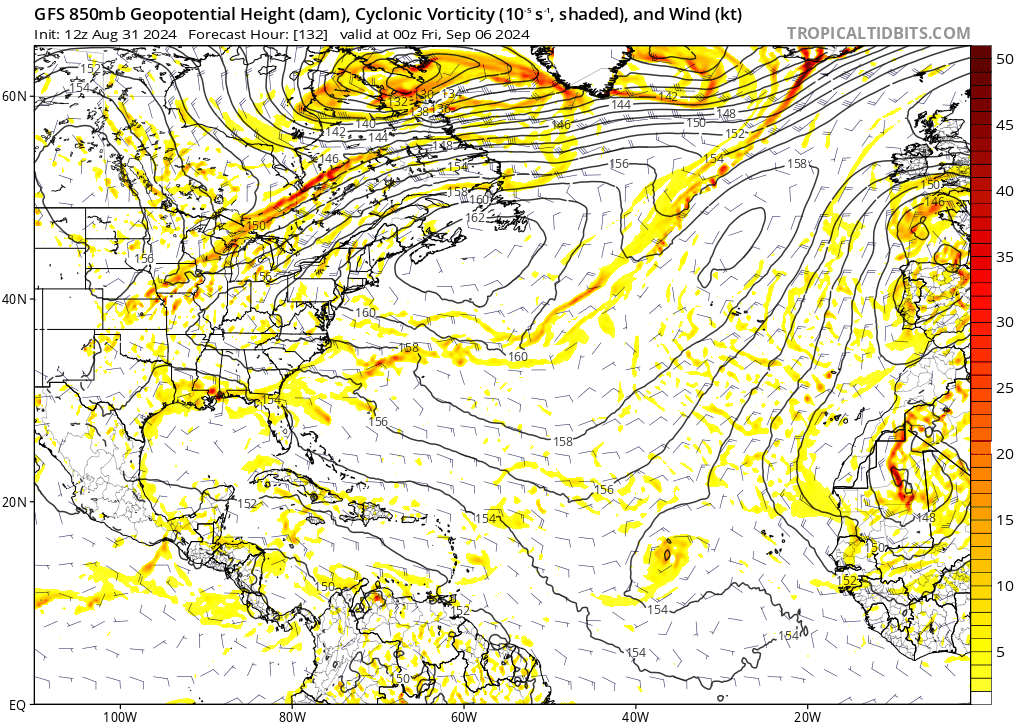
Eastern Tropical Atlantic:
Another tropical wave just emerging off the coast of Africa is
currently associated with an area of disorganized showers and
thunderstorms. Some slow development of this system is possible
through the middle portion of next week as it moves slowly to the
west-northwest or northwest over the Eastern Tropical Atlantic.
* Formation chance through 48 hours...low...near 0 percent.
* Formation chance through 7 days...low...20 percent.
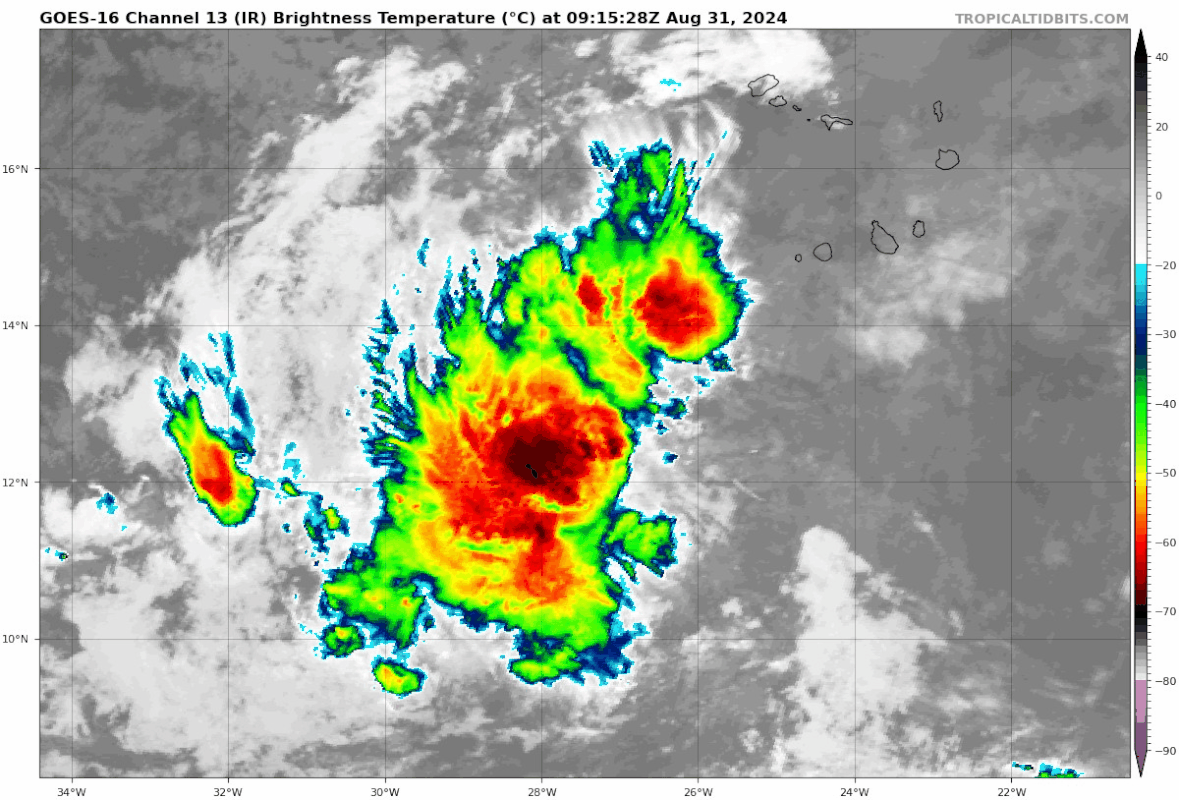


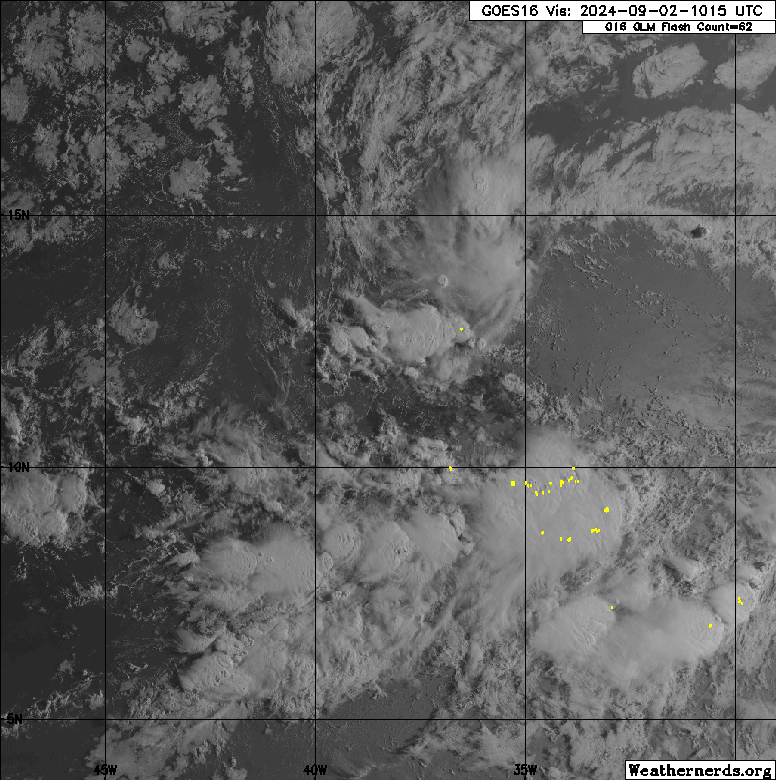

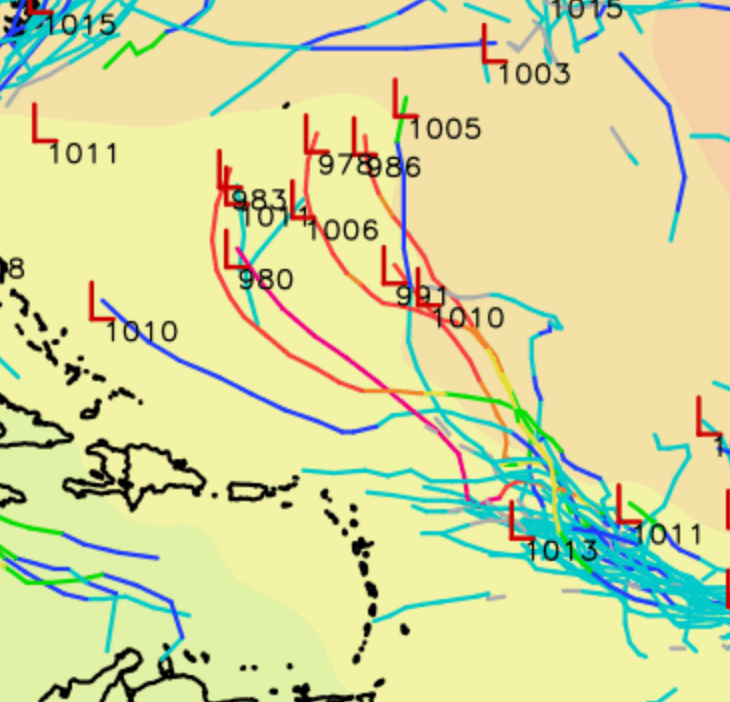


 area starting look better tonight it got some models supports let see 2am outlook say