Discussion of Intense Tropical Cyclones

This is the general tropical discussion area. Anyone can take their shot at predicting a storms path.

Moderator: S2k Moderators

Forum rules

The posts in this forum are NOT official forecasts and should not be used as such. They are just the opinion of the poster and may or may not be backed by sound meteorological data. They are NOT endorsed by any professional institution or STORM2K. For official information, please refer to products from the National Hurricane Center and National Weather Service.

Help Support Storm2K
Message
Author
Hurricane2000
Tropical Low
Tropical Low
Posts: 23
Joined: Sat Dec 28, 2024 4:50 pm

Re: Discussion of Intense Tropical Cyclones

#761 Postby Hurricane2000 » Sun Jan 26, 2025 11:41 am

kevin wrote:
Hurricane2000 wrote:What do you think of Gaemi 2024?


That's a very interesting one. At some point it might be better for me to make my own thread for these analyses (especially of non–recon typhoons). I've thought about that before and would also make it a bit more rigorous than what I'm doing now, but who knows. Anyways, let's make this the last of its kind for now so I don't spam this thread.

ADT
2024JUL23 220000 5.0 948.5 90.0 5.0 6.1 6.6 1.3T/6hr OFF OFF OFF OFF -26.86 -78.00 EYE/P -99 IR 41.8 23.13 -123.32 ARCHER HIM-9 33.4
2024JUL24 053000 6.0 927.2 115.0 5.9 6.0 6.0 NO LIMIT ON OFF OFF OFF -23.86 -73.28 EYE -99 IR 61.0 24.10 -122.54 ARCHER HIM-9 34.7

Raw T# peaked at 6.6 with a CI# peak of 6.0. I'm going with CI and thus 115 kt, 919 mb for the ADT intensity estimate.

AiDT
20240724 050000 115 112 120
20240724 053000 115 113 120
20240724 060000 115 113 125
20240724 063000 115 113 125
20240724 070000 115 114 125

During the same time period AiDT peaked at 114 kt.

AMSU
WP, 05, 202407240258, 30, AMSU, IP, , 2384N, 12320E, , 2, 152, 1, 896, 1, MEAS, , , , , , , , , , , , 9, , W, CIMS, , , , , , , , 896, , NOAA18, , , , , , , , , , , , , , , , , , , ,

AMSU peaked at 152 kt and 896 mb on the 24th of July.

D-MINT
20240724 0512 UTC AMSR2 930 hPa 128 kts 121 kts 135 kts
D-MINT had a peak intensity of 128 kt, 930 mb.

D-PRINT
20240724 0900 UTC 923 hPa 125 kts 118 kts 132 kts
At a similar time as D-MINT, D-PRINT peaked at 125 kt, 923 mb.

SATCON
2024 WP 05 206.167 2024JUL24 040000 23.97 -122.84 3 914 137

SATCON peaked at 137 kt, 914 mb.

Wind blend
All of the above estimates show a peak intensity in the morning of July 24 with a blend of 129 kt, 916 mb.

KZC relationship
Now before continuing I have to add that this is a very difficult storm to estimate. ADT/AiDT are significantly lower than the other estimates and these 2 methods are known to have difficulty handling pinhole eye systems, especially when the eye fixes are a little bit off. For example hurricane Wilma would only be 135 kt, 932 mb according to the automated ADT due to this issue. I still have to think of a good way to take this into account for these analyses since it is a common issue with short-lived pinhole systems. But for now, in this case, I'm leaning towards discarding both ADT and AiDT for the intensity blend. This results in a blend of of 136 kt, 916 mb.

Now I use the KZC relationship to find a potentially more accurate pressure value associated with the wind speed of 135 kt (rounded down from 136 kt since we usually work in steps of 5 kt). For this I used the following input values during peak intensity around 06:00z.
Vmax = 135 kt
C = 8 kt
R34 = 182 nm
Lat = 24.2 deg
Background pressure = 998 mb

This then results in a pressure estimate of 907 mb.

Conclusion
The official peak intensity for typhoon Gaemi is 125 kt, 919 mb. Based on a blend of all available satellite estimates and the KZC relationship, I estimate that Gaemi's peak intensity was significantly stronger at 135 kt, 907 mb in the early hours of July 24. However, as mentioned before, I have to note that Gaemi is an exceptionally difficult storm to estimate. The AMSU sounder for example shows high confidence (an uncertainty of only 12 kt) for a peak strength of a whopping 152 kt, while even the high-end uncertainty window for D-PRINT already ends at 132 kt. Such large discrepancies are unusual and the result of Gaemi's, at times, pinhole eye combined with the fact that the eye never cleared for a prolonged period of time. Since the eye is so important for the satellite fixes, the different algorithms behave in a very different manner.

Just after Gaemi passed I also made an intensity estimate (https://www.storm2k.org/phpbb2/viewtopic.php?f=95&t=124162&start=60#p3076141) where I estimated 140 kt, 901 mb after some fixes to the gale radius. Since then, more accurate values for the translational speed and R34 have become available which have nudged the estimate down a bit. And in hindsight I think I was a bit overreliant on the 152 kt AMSU data to push my estimate to 140 kt. 140 kt might be possible, but looking at the data now months later I wouldn't pull the trigger on it myself. Other estimates such as ATMS (133 kt) and SSMIS (133 kt) also hint at an intensity around 130 - 135 kt, while estimates such as CIRA ATMS (101 kt) show the difficulty to analyze Gaemi. A gradient wind balance estimate I found even showed a peak intensity in the 880s mb, so in conclusion I'd put less confidence in my estimate (or any other estimate) than usual.


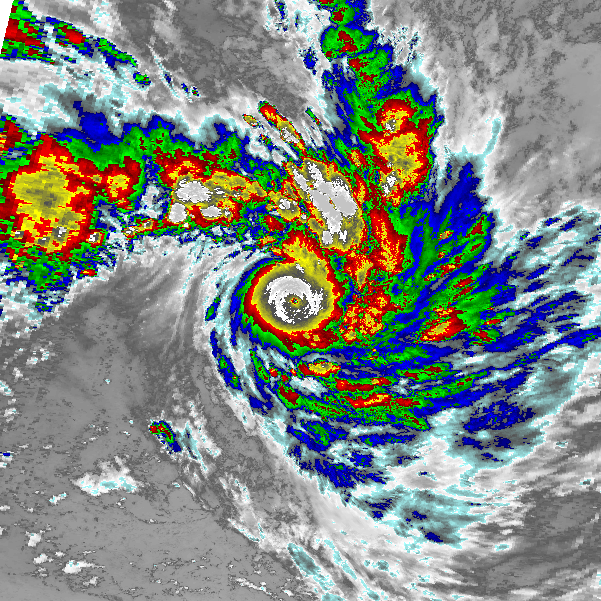
Here's a good one, Cyclone Gavin of 1997 looks extremely impressive. Very underrated storm (in my opinion) what do you think?
0 likes   
Weather = Cool 8-)

Hurricane2000
Tropical Low
Tropical Low
Posts: 23
Joined: Sat Dec 28, 2024 4:50 pm

Re: Discussion of Intense Tropical Cyclones

#762 Postby Hurricane2000 » Sun Jan 26, 2025 11:45 am

Image
Image
Image
These images speak for themselves.
3 likes   
Weather = Cool 8-)

User avatar
Hurricane2022
Category 5
Category 5
Posts: 1496
Joined: Tue Aug 23, 2022 11:38 pm
Location: Araçatuba, Brazil

Re: Discussion of Intense Tropical Cyclones

#763 Postby Hurricane2022 » Sun Jan 26, 2025 1:12 pm


That's Mr Gavin, from SPAC. Is there any experts here to do an analysis on this cyclone?
1 likes   
Sorry for the bad English sometimes...!
For reliable and detailed information for any meteorological phenomenon, please consult the National Hurricane Center, Joint Typhoon Warning Center , or your local Meteo Center.

--------

Una cvm Christo, pro Christo, et in Christo. Sit nomen Domini benedictvm.

User avatar
kevin
Category 5
Category 5
Posts: 2554
Age: 26
Joined: Wed Aug 28, 2019 4:35 am

Re: Discussion of Intense Tropical Cyclones

#764 Postby kevin » Wed Jan 29, 2025 6:44 am


After some searching I found some more satellite VIS and IR imagery of Gavin. Gavin had two peaks, one around March 5 - 6 and the other around March 9. Both peaks were operationally assessed at 925 mbar and wind speed of 115 and 120 kt, respectively. Based on an intuitive look of the satellite imagery of the first peak, I have to agree that Gavin was most likely significantly stronger during that peak. However, this was quite a fast ramp-up and ramp-down system as Gavin weakened to a low-end cat 3 in between the peaks due to a collapse of the (most-likely) pinhole eye. In that sense Gavin could be like Eta where the intensity of the storm did not have enough time to catch up with the satellite appearance.

So I'd want to do a full manual Dvorak analysis of the storm during its life cycle including intensification restrictions to give a good estimate of how strong it could've become during its first peak. This is a topic that I do have some knowledge on, but not enough to do it right now so I'd need to do some additional reading. And I think the analysis itself would also take some time. So it's a really interesting topic, but I don't know if/when I'll have time for it. If I do finish it at some point I'll post it where (could be in 2 days or in 2 months).

Also, I can't find any original source for the NOAA-14 IR/VIS imagery you quoted besides the Twitter posts. So while the images do look somewhat similar to the imagery I found around 05/03/1997, I can't know for sure that they haven't been adjusted (f.e. with an algorithm to increase the resolution) or anything like that which could affect its usability for an intensity estimate. So if I'd make an Dvorak estimate I'd discard these images and use the open-source imagery of Himawari-5 (GMS-5) satellite instead.

Edit: there is archive data from GOES-9 which captured Gavin around its peak. I can access the low-resolution imagery, but I think higher resolution imagery is also available. However, I don't have access to this. I just submitted a request to access this imagery (which I don't think has been posted on the internet by anyone outside of the protected GOES database). My personal guess is that, if such data exists, it's has just been dumped in the database without going through it in detail, because tbh the US agencies don't really have an interest in SPac TCs and the SPac doesn't really do post-season analyses in the same way NHC does as far as I know. So we might be the first people to look at these images with the actual intent of analyzing the intensity of Gavin. Or maybe not, we'll have to wait to see if this journey down the rabbit hole will lead to something interesting.
2 likes   

Hurricane2000
Tropical Low
Tropical Low
Posts: 23
Joined: Sat Dec 28, 2024 4:50 pm

Re: Discussion of Intense Tropical Cyclones

#765 Postby Hurricane2000 » Wed Jan 29, 2025 8:44 am

kevin wrote:


After some searching I found some more satellite VIS and IR imagery of Gavin. Gavin had two peaks, one around March 5 - 6 and the other around March 9. Both peaks were operationally assessed at 925 mbar and wind speed of 115 and 120 kt, respectively. Based on an intuitive look of the satellite imagery of the first peak, I have to agree that Gavin was most likely significantly stronger during that peak. However, this was quite a fast ramp-up and ramp-down system as Gavin weakened to a low-end cat 3 in between the peaks due to a collapse of the (most-likely) pinhole eye. In that sense Gavin could be like Eta where the intensity of the storm did not have enough time to catch up with the satellite appearance.

So I'd want to do a full manual Dvorak analysis of the storm during its life cycle including intensification restrictions to give a good estimate of how strong it could've become during its first peak. This is a topic that I do have some knowledge on, but not enough to do it right now so I'd need to do some additional reading. And I think the analysis itself would also take some time. So it's a really interesting topic, but I don't know if/when I'll have time for it. If I do finish it at some point I'll post it where (could be in 2 days or in 2 months).

Also, I can't find any original source for the NOAA-14 IR/VIS imagery you quoted besides the Twitter posts. So while the images do look somewhat similar to the imagery I found around 05/03/1997, I can't know for sure that they haven't been adjusted (f.e. with an algorithm to increase the resolution) or anything like that which could affect its usability for an intensity estimate. So if I'd make an Dvorak estimate I'd discard these images and use the open-source imagery of Himawari-5 (GMS-5) satellite instead.

Edit: there is archive data from GOES-9 which captured Gavin around its peak. I can access the low-resolution imagery, but I think higher resolution imagery is also available. However, I don't have access to this. I just submitted a request to access this imagery (which I don't think has been posted on the internet by anyone outside of the protected GOES database). My personal guess is that, if such data exists, it's has just been dumped in the database without going through it in detail, because tbh the US agencies don't really have an interest in SPac TCs and the SPac doesn't really do post-season analyses in the same way NHC does as far as I know. So we might be the first people to look at these images with the actual intent of analyzing the intensity of Gavin. Or maybe not, we'll have to wait to see if this journey down the rabbit hole will lead to something interesting.


Could you post the images that you found or find?
0 likes   
Weather = Cool 8-)

User avatar
kevin
Category 5
Category 5
Posts: 2554
Age: 26
Joined: Wed Aug 28, 2019 4:35 am

Re: Discussion of Intense Tropical Cyclones

#766 Postby kevin » Wed Jan 29, 2025 9:29 am

Hurricane2000 wrote:
kevin wrote:


After some searching I found some more satellite VIS and IR imagery of Gavin. Gavin had two peaks, one around March 5 - 6 and the other around March 9. Both peaks were operationally assessed at 925 mbar and wind speed of 115 and 120 kt, respectively. Based on an intuitive look of the satellite imagery of the first peak, I have to agree that Gavin was most likely significantly stronger during that peak. However, this was quite a fast ramp-up and ramp-down system as Gavin weakened to a low-end cat 3 in between the peaks due to a collapse of the (most-likely) pinhole eye. In that sense Gavin could be like Eta where the intensity of the storm did not have enough time to catch up with the satellite appearance.

So I'd want to do a full manual Dvorak analysis of the storm during its life cycle including intensification restrictions to give a good estimate of how strong it could've become during its first peak. This is a topic that I do have some knowledge on, but not enough to do it right now so I'd need to do some additional reading. And I think the analysis itself would also take some time. So it's a really interesting topic, but I don't know if/when I'll have time for it. If I do finish it at some point I'll post it where (could be in 2 days or in 2 months).

Also, I can't find any original source for the NOAA-14 IR/VIS imagery you quoted besides the Twitter posts. So while the images do look somewhat similar to the imagery I found around 05/03/1997, I can't know for sure that they haven't been adjusted (f.e. with an algorithm to increase the resolution) or anything like that which could affect its usability for an intensity estimate. So if I'd make an Dvorak estimate I'd discard these images and use the open-source imagery of Himawari-5 (GMS-5) satellite instead.

Edit: there is archive data from GOES-9 which captured Gavin around its peak. I can access the low-resolution imagery, but I think higher resolution imagery is also available. However, I don't have access to this. I just submitted a request to access this imagery (which I don't think has been posted on the internet by anyone outside of the protected GOES database). My personal guess is that, if such data exists, it's has just been dumped in the database without going through it in detail, because tbh the US agencies don't really have an interest in SPac TCs and the SPac doesn't really do post-season analyses in the same way NHC does as far as I know. So we might be the first people to look at these images with the actual intent of analyzing the intensity of Gavin. Or maybe not, we'll have to wait to see if this journey down the rabbit hole will lead to something interesting.


Could you post the images that you found or find?


When I am able to get the better/high-res images I'll post those. What I have so far:

NOAA GIBBS has archive imagery of GOES-9 and GMS 5, including images of Gavin's peak: https://www.ncdc.noaa.gov/gibbs/availability/1997-03-05. There are low-res, unfortunately. It looks like some higher res imagery might be available, but I haven't looked into that yet.

The SDS Inventory has GOES-9 archive imagery: https://inventory.ssec.wisc.edu/inventory/#search&start_time:1997-03-01%2000:00;end_time:1997-03-31%2023:59;satellite:GOES-9;format:year;. This website contains all images collected by GOES-9 and, if indeed of high enough resolution, would be of great value. However, being able to zoom and get specific datasets requires an approved request. So I have now entered a request to get access to this data. if that doesn't go through I might look at GIBBS again.

NASA EarthData also allows you to download NOAA-14 images as nc files, which might be something to look into as those contain surface reflectivity data for the full disk: https://search.earthdata.nasa.gov/search.
0 likes   

User avatar
kevin
Category 5
Category 5
Posts: 2554
Age: 26
Joined: Wed Aug 28, 2019 4:35 am

Re: Discussion of Intense Tropical Cyclones

#767 Postby kevin » Wed Jan 29, 2025 10:03 am

Hurricane2000 wrote:
kevin wrote:


After some searching I found some more satellite VIS and IR imagery of Gavin. Gavin had two peaks, one around March 5 - 6 and the other around March 9. Both peaks were operationally assessed at 925 mbar and wind speed of 115 and 120 kt, respectively. Based on an intuitive look of the satellite imagery of the first peak, I have to agree that Gavin was most likely significantly stronger during that peak. However, this was quite a fast ramp-up and ramp-down system as Gavin weakened to a low-end cat 3 in between the peaks due to a collapse of the (most-likely) pinhole eye. In that sense Gavin could be like Eta where the intensity of the storm did not have enough time to catch up with the satellite appearance.

So I'd want to do a full manual Dvorak analysis of the storm during its life cycle including intensification restrictions to give a good estimate of how strong it could've become during its first peak. This is a topic that I do have some knowledge on, but not enough to do it right now so I'd need to do some additional reading. And I think the analysis itself would also take some time. So it's a really interesting topic, but I don't know if/when I'll have time for it. If I do finish it at some point I'll post it where (could be in 2 days or in 2 months).

Also, I can't find any original source for the NOAA-14 IR/VIS imagery you quoted besides the Twitter posts. So while the images do look somewhat similar to the imagery I found around 05/03/1997, I can't know for sure that they haven't been adjusted (f.e. with an algorithm to increase the resolution) or anything like that which could affect its usability for an intensity estimate. So if I'd make an Dvorak estimate I'd discard these images and use the open-source imagery of Himawari-5 (GMS-5) satellite instead.

Edit: there is archive data from GOES-9 which captured Gavin around its peak. I can access the low-resolution imagery, but I think higher resolution imagery is also available. However, I don't have access to this. I just submitted a request to access this imagery (which I don't think has been posted on the internet by anyone outside of the protected GOES database). My personal guess is that, if such data exists, it's has just been dumped in the database without going through it in detail, because tbh the US agencies don't really have an interest in SPac TCs and the SPac doesn't really do post-season analyses in the same way NHC does as far as I know. So we might be the first people to look at these images with the actual intent of analyzing the intensity of Gavin. Or maybe not, we'll have to wait to see if this journey down the rabbit hole will lead to something interesting.


Could you post the images that you found or find?


Okay so I got access to the data. I'm at work now so I don't really have time to do a deep dive into the data, but I did a quick search and the images are incredible, so much stuff is available that I never knew we 'regular people' could access. Here is an image of cyclone Gavin made by GOES-9 at 15z on March 5, 1997.

Image

Image

I also included the same image with increased contrast to better see the eye of the storm.

Image

And a mask I made myself to identify the eye in the imagery. The imagery indeed seems to confirm that Gavin had a pinhole eye. Based on these images (which are B/W IR images), the eye had a size of roughly 6 - 8 km (3 - 4 nm, 4 - 5 mi) depending on how you measure it. While this imagery is not a conclusive way to determine the size of the eye, this is a very strong indication that for a brief period Gavin indeed had a tiny Milton-sized pinhole eye.

Image

Edit: and based on some coloring and a lot of tweaking here is a colorized version combining the above images. This is NOT a real color satellite imagery, the colors have been added and light settings have been adjusted to simulate the look of VIS satellite imagery. But this is just to give an idea of what Gavin might've looked like if we got a perfect color image.

Image

Edit: and considering that the eye had WMG pixels based on your previous post, you could make it more realistic by drastically increasing contrast in the eye. Whether Gavin's eye was truly ever this clear on VIS is of course something we'll never know for sure.

Image
Last edited by kevin on Thu Jan 30, 2025 5:04 am, edited 1 time in total.
6 likes   

Hurricane2000
Tropical Low
Tropical Low
Posts: 23
Joined: Sat Dec 28, 2024 4:50 pm

Re: Discussion of Intense Tropical Cyclones

#768 Postby Hurricane2000 » Wed Jan 29, 2025 12:20 pm

kevin wrote:
Hurricane2000 wrote:
kevin wrote:
After some searching I found some more satellite VIS and IR imagery of Gavin. Gavin had two peaks, one around March 5 - 6 and the other around March 9. Both peaks were operationally assessed at 925 mbar and wind speed of 115 and 120 kt, respectively. Based on an intuitive look of the satellite imagery of the first peak, I have to agree that Gavin was most likely significantly stronger during that peak. However, this was quite a fast ramp-up and ramp-down system as Gavin weakened to a low-end cat 3 in between the peaks due to a collapse of the (most-likely) pinhole eye. In that sense Gavin could be like Eta where the intensity of the storm did not have enough time to catch up with the satellite appearance.

So I'd want to do a full manual Dvorak analysis of the storm during its life cycle including intensification restrictions to give a good estimate of how strong it could've become during its first peak. This is a topic that I do have some knowledge on, but not enough to do it right now so I'd need to do some additional reading. And I think the analysis itself would also take some time. So it's a really interesting topic, but I don't know if/when I'll have time for it. If I do finish it at some point I'll post it where (could be in 2 days or in 2 months).

Also, I can't find any original source for the NOAA-14 IR/VIS imagery you quoted besides the Twitter posts. So while the images do look somewhat similar to the imagery I found around 05/03/1997, I can't know for sure that they haven't been adjusted (f.e. with an algorithm to increase the resolution) or anything like that which could affect its usability for an intensity estimate. So if I'd make an Dvorak estimate I'd discard these images and use the open-source imagery of Himawari-5 (GMS-5) satellite instead.

Edit: there is archive data from GOES-9 which captured Gavin around its peak. I can access the low-resolution imagery, but I think higher resolution imagery is also available. However, I don't have access to this. I just submitted a request to access this imagery (which I don't think has been posted on the internet by anyone outside of the protected GOES database). My personal guess is that, if such data exists, it's has just been dumped in the database without going through it in detail, because tbh the US agencies don't really have an interest in SPac TCs and the SPac doesn't really do post-season analyses in the same way NHC does as far as I know. So we might be the first people to look at these images with the actual intent of analyzing the intensity of Gavin. Or maybe not, we'll have to wait to see if this journey down the rabbit hole will lead to something interesting.


Could you post the images that you found or find?


Okay so I got access to the data. I'm at work now so I don't really have time to do a deep dive into the data, but I did a quick search and the images are incredible, so much stuff is available that I never knew we 'regular people' could access. Here is an image of cyclone Gavin made by GOES-9 at 15z on March 5, 1997.

https://i.imgur.com/3bFxIq4.png

https://i.imgur.com/QTvIpNx.png

I also included the same image with increased contrast to better see the eye of the storm.

https://i.imgur.com/WpUgLCC.png

And a mask I made myself to identify the eye in the imagery. The imagery indeed seems to confirm that Gavin had a pinhole eye. Based on these images (which are B/W IR images), the eye had a size of roughly 6 - 8 km (3 - 4 nm, 4 - 5 mi) depending on how you measure it. While this imagery is not a conclusive way to determine the size of the eye, this is a very strong indication that for a brief period Gavin indeed had a tiny Milton-sized pinhole eye.

https://i.imgur.com/Q01h4m1.png

Edit: and based on some coloring and a lot of tweaking here is a colorized version combining the above images. This is NOT a real color satellite imagery, the colors have been added and light settings have been adjusted to simulate the look of VIS satellite imagery. But this is just to give an idea of what Gavin might've looked like if we got a perfect color image.

https://i.imgur.com/cZwgYfM.jpeg

WOW. Very Impressive. Good luck with analyzing Gavin
0 likes   
Weather = Cool 8-)

Hurricane2000
Tropical Low
Tropical Low
Posts: 23
Joined: Sat Dec 28, 2024 4:50 pm

Re: Discussion of Intense Tropical Cyclones

#769 Postby Hurricane2000 » Sun Feb 02, 2025 11:37 am

Another storm that has piqued my interest is typhoon Lupit of 2003. Just look at it!
Image
Image
Image
7 likes   
Weather = Cool 8-)

User avatar
WaveBreaking
Category 2
Category 2
Posts: 561
Joined: Sun Jun 30, 2024 11:33 am
Location: US

Re: Discussion of Intense Tropical Cyclones

#770 Postby WaveBreaking » Sat Feb 08, 2025 11:26 am

5 likes   
I am NOT a professional meteorologist, so take all of my posts with a grain of salt. My opinions are mine and mine alone.

Hurricane2000
Tropical Low
Tropical Low
Posts: 23
Joined: Sat Dec 28, 2024 4:50 pm

Re: Discussion of Intense Tropical Cyclones

#771 Postby Hurricane2000 » Sat Feb 08, 2025 11:33 pm


You beat me to it :lol:
1 likes   
Weather = Cool 8-)

Hurricane2000
Tropical Low
Tropical Low
Posts: 23
Joined: Sat Dec 28, 2024 4:50 pm

Re: Discussion of Intense Tropical Cyclones

#772 Postby Hurricane2000 » Sat Feb 08, 2025 11:35 pm

Typhoon Dale 1996 was a beast
Image
3 likes   
Weather = Cool 8-)

User avatar
kevin
Category 5
Category 5
Posts: 2554
Age: 26
Joined: Wed Aug 28, 2019 4:35 am

Re: Discussion of Intense Tropical Cyclones

#773 Postby kevin » Sun Feb 09, 2025 6:36 am


Wow. With Tip I often thought 'is that it?' with the available imagery, but that's probably mostly attributed to the lesser quality of those old images. Because with this high-res image I completely understand how it could have a record-low pressure. Pretty much a perfect TC.
4 likes   

User avatar
Ptarmigan
Category 5
Category 5
Posts: 5313
Joined: Wed Aug 16, 2006 9:06 pm

Re: Discussion of Intense Tropical Cyclones

#774 Postby Ptarmigan » Sun Feb 09, 2025 11:11 pm


Super Typhoon Tip looks like a monster. I wonder how far hurricane force winds extending with Tip. If Tip hit New Orleans, Houston, New York City, or Ganges Delta, they will never be the same. :( :cry:
1 likes   

User avatar
Ptarmigan
Category 5
Category 5
Posts: 5313
Joined: Wed Aug 16, 2006 9:06 pm

Re: Discussion of Intense Tropical Cyclones

#775 Postby Ptarmigan » Sun Feb 09, 2025 11:22 pm

kevin wrote:
Hurricane2000 wrote:
kevin wrote:
After some searching I found some more satellite VIS and IR imagery of Gavin. Gavin had two peaks, one around March 5 - 6 and the other around March 9. Both peaks were operationally assessed at 925 mbar and wind speed of 115 and 120 kt, respectively. Based on an intuitive look of the satellite imagery of the first peak, I have to agree that Gavin was most likely significantly stronger during that peak. However, this was quite a fast ramp-up and ramp-down system as Gavin weakened to a low-end cat 3 in between the peaks due to a collapse of the (most-likely) pinhole eye. In that sense Gavin could be like Eta where the intensity of the storm did not have enough time to catch up with the satellite appearance.

So I'd want to do a full manual Dvorak analysis of the storm during its life cycle including intensification restrictions to give a good estimate of how strong it could've become during its first peak. This is a topic that I do have some knowledge on, but not enough to do it right now so I'd need to do some additional reading. And I think the analysis itself would also take some time. So it's a really interesting topic, but I don't know if/when I'll have time for it. If I do finish it at some point I'll post it where (could be in 2 days or in 2 months).

Also, I can't find any original source for the NOAA-14 IR/VIS imagery you quoted besides the Twitter posts. So while the images do look somewhat similar to the imagery I found around 05/03/1997, I can't know for sure that they haven't been adjusted (f.e. with an algorithm to increase the resolution) or anything like that which could affect its usability for an intensity estimate. So if I'd make an Dvorak estimate I'd discard these images and use the open-source imagery of Himawari-5 (GMS-5) satellite instead.

Edit: there is archive data from GOES-9 which captured Gavin around its peak. I can access the low-resolution imagery, but I think higher resolution imagery is also available. However, I don't have access to this. I just submitted a request to access this imagery (which I don't think has been posted on the internet by anyone outside of the protected GOES database). My personal guess is that, if such data exists, it's has just been dumped in the database without going through it in detail, because tbh the US agencies don't really have an interest in SPac TCs and the SPac doesn't really do post-season analyses in the same way NHC does as far as I know. So we might be the first people to look at these images with the actual intent of analyzing the intensity of Gavin. Or maybe not, we'll have to wait to see if this journey down the rabbit hole will lead to something interesting.


Could you post the images that you found or find?


Okay so I got access to the data. I'm at work now so I don't really have time to do a deep dive into the data, but I did a quick search and the images are incredible, so much stuff is available that I never knew we 'regular people' could access. Here is an image of cyclone Gavin made by GOES-9 at 15z on March 5, 1997.

https://i.imgur.com/3bFxIq4.png

https://i.imgur.com/QTvIpNx.png

I also included the same image with increased contrast to better see the eye of the storm.

https://i.imgur.com/WpUgLCC.png

And a mask I made myself to identify the eye in the imagery. The imagery indeed seems to confirm that Gavin had a pinhole eye. Based on these images (which are B/W IR images), the eye had a size of roughly 6 - 8 km (3 - 4 nm, 4 - 5 mi) depending on how you measure it. While this imagery is not a conclusive way to determine the size of the eye, this is a very strong indication that for a brief period Gavin indeed had a tiny Milton-sized pinhole eye.

https://i.imgur.com/Q01h4m1.png

Edit: and based on some coloring and a lot of tweaking here is a colorized version combining the above images. This is NOT a real color satellite imagery, the colors have been added and light settings have been adjusted to simulate the look of VIS satellite imagery. But this is just to give an idea of what Gavin might've looked like if we got a perfect color image.

https://i.imgur.com/cZwgYfM.jpeg

Edit: and considering that the eye had WMG pixels based on your previous post, you could make it more realistic by drastically increasing contrast in the eye. Whether Gavin's eye was truly ever this clear on VIS is of course something we'll never know for sure.

https://i.imgur.com/0QTOtQ3.png


I always thought Tropical Cyclone Gavin was very intense. I would not be surprised if Gavin was on par with Tip.
1 likes   

User avatar
Hurricane2022
Category 5
Category 5
Posts: 1496
Joined: Tue Aug 23, 2022 11:38 pm
Location: Araçatuba, Brazil

Re: Discussion of Intense Tropical Cyclones

#776 Postby Hurricane2022 » Sun Feb 16, 2025 5:48 am

 https://x.com/zeb199818/status/1891069312791683325


Today marks 20 years since Severe Tropical Cyclone OLAF peaked.
It was cool to read this topic below.
Estimating Cyclone Olaf (2005)'s central pressure using the Schloemer Equation
0 likes   
Sorry for the bad English sometimes...!
For reliable and detailed information for any meteorological phenomenon, please consult the National Hurricane Center, Joint Typhoon Warning Center , or your local Meteo Center.

--------

Una cvm Christo, pro Christo, et in Christo. Sit nomen Domini benedictvm.

Hurricane2000
Tropical Low
Tropical Low
Posts: 23
Joined: Sat Dec 28, 2024 4:50 pm

Re: Discussion of Intense Tropical Cyclones

#777 Postby Hurricane2000 » Sun Feb 16, 2025 6:41 pm

A storm I would like to bring to everyone's attention is Super Typhoon Irma of 1971. Officially rated at 180mph and 884mb, this storm has been reanalyzed by Ryan Allen (1900hurricane) at 870mb! This storm definitely deserves some discussion, what do you guys think?
 https://x.com/1900hurricane/status/1865211859088912714


Image
4 likes   
Weather = Cool 8-)

Hurricane2000
Tropical Low
Tropical Low
Posts: 23
Joined: Sat Dec 28, 2024 4:50 pm

Re: Discussion of Intense Tropical Cyclones

#778 Postby Hurricane2000 » Sun Mar 02, 2025 11:58 am

Typhoon Vanessa 1984's recon data states that the lowest MSLP was 879mb, however, Vanessa's 700mb height was 2022 meters, I've heard this leads to a lower central pressure but I'm not sure how to calculate it, anyone here know how?
0 likes   
Weather = Cool 8-)

User avatar
FireRat
Category 5
Category 5
Posts: 1239
Age: 37
Joined: Sun Sep 26, 2010 11:38 pm
Location: North Carolina

Re: Discussion of Intense Tropical Cyclones

#779 Postby FireRat » Thu Mar 06, 2025 4:55 pm


Oh wow, never seen a near peak image of 1996 Dale, wow! No wonder he was put at 150 kt peak if not mistaken. Yet another November monster. :eek:
0 likes   
Georges '98, Irene '99, Frances '04, Jeanne '04, Katrina '05, Wilma '05, Gustav '08, Isaac '12, Matthew '16, Florence '18, Michael '18, Ian '22

Hurricane2000
Tropical Low
Tropical Low
Posts: 23
Joined: Sat Dec 28, 2024 4:50 pm

Re: Discussion of Intense Tropical Cyclones

#780 Postby Hurricane2000 » Sun Mar 16, 2025 4:31 pm

I got a good question for y'all, if reconnaissance never went into Hurricane Patricia 2015, (Like most WPAC storms), what would your estimates be? Feel free to provide explanations as to why!
0 likes   
Weather = Cool 8-)


Return to “Talkin' Tropics”

Who is online

Users browsing this forum: Kennethb and 66 guests