2025 Indicators: SST's, MSLP, Shear, SAL, Steering, Instability (Day 16+ Climate Models)

This is the general tropical discussion area. Anyone can take their shot at predicting a storms path.

Moderator: S2k Moderators

Forum rules

The posts in this forum are NOT official forecasts and should not be used as such. They are just the opinion of the poster and may or may not be backed by sound meteorological data. They are NOT endorsed by any professional institution or STORM2K. For official information, please refer to products from the National Hurricane Center and National Weather Service.

Help Support Storm2K
Message
Author
User avatar
DorkyMcDorkface
Category 3
Category 3
Posts: 887
Age: 27
Joined: Mon Sep 30, 2019 1:32 pm
Location: Mid-Atlantic

Re: 2025 Indicators: SST's, MSLP, Shear, SAL, Steering, Instability (Day 16+ Climate Models)

#301 Postby DorkyMcDorkface » Wed Jun 18, 2025 9:41 am

I believe I've talked about this before, but I'm inclined to believe the general bearishness many seem to have towards this season is primarily a result of people being blown away by how extreme SSTs in the tropics were over the past two years. Now that they're more tepid and the overall config isn't as favorable, the expectations are lowered significantly. While I absolutely agree we're likely not going to see the level of activity we saw last year, and that there's a decent chance we'll see some issues regarding stability and what not due to the EOF2-esque buildup of subtropical warmth (if it persists anyway) I still think we're on track for an above average season, and that we may be jumping the gun a bit.

I think what should especially be emphasized is that the current SST configuration, while not the most ideal, is still a better look than 2018, 2019 and 2021 at this juncture. All three of those seasons finished decently above average ACE-wise, and were a part of this current amplified WAM regime which has been in place for nearly a decade now, which we know naturally slows trades in the MDR and leads to warming, in addition to producing a strong wave train. You'll see this year has more of a +AMO-like look than any of those years combined. Also worth mentioning two of those years had +ENSO and +PDO/+PMM (2018 especially for the latter two factors, which contributed to the record activity in the EPAC that season). All three of those are negative at the present time (which is why I believe the EPAC will likely slow significantly after this record-breaking start).
Image
My point is if we were somehow able to muster active seasons out of those three years, I think we're in a good position for 2025 to manage to get to that point as well given most factors are more favorable than those years.
4 likes   
Please note the thougths expressed by this account are solely those of the user and are from a hobbyist perspective. For more comprehensive analysis, consult an actual professional meteorologist or meteorology agency.


Floyd 1999 | Isabel 2003 | Hanna 2008 | Irene 2011 | Sandy 2012 | Isaias 2020

WeatherBoy2000
Category 1
Category 1
Posts: 344
Joined: Mon Apr 10, 2023 9:29 am

Re: 2025 Indicators: SST's, MSLP, Shear, SAL, Steering, Instability (Day 16+ Climate Models)

#302 Postby WeatherBoy2000 » Wed Jun 18, 2025 9:47 am

aspen wrote:
LarryWx wrote:The latest Euro Weeklies, which go through July 13th, have mainly quiet in the Atlantic basin and near normal ACE in the E and W Pacific. If there are no TCs by July 13th, this would mean the quietest start in the Atlantic since 2009! Other years with no NS through July 13th since 1995 were 1998, 2000, 2002, and 2004.

I really wish I could say otherwise (I’d love to finally see a weak season), but I still expect an above normal season. The Atlantic tropics, though not nearly as warm as 2023-4, are still plenty warm enough and expected to continue that way. Also, we’re looking at a ~weak La Niña during ASO per RONI. That combo typically correlates to active seasons including for the corridor from the NE Caribbean through Bahamas, FL, SE US, and E Gulf though I’m still hoping it won’t be nearly as bad there as the terrible 2024, which is suggested by the last two monthly Euro seasonal outlooks.

Interestingly, more than half of the seasons in the last 30 years without a TS before July 13th (1998, 2000, and 2004) were at least somewhat above-average. So that by itself doesn’t mean we’ll get another 2002 or 2009-esqe year, but looking at the mixed to slightly unfavorable long-term environmental forecasts, I think we could be in for the least active season since 2015.

We’re probably not going to see much early development this year as opposed to 2020-24, with all of the Central American disturbances forming in the EPac and sinking patterns forecast later in June into July. Perhaps we’ll see something like 2019 where it takes until late August for activity to full ramp up (no more than 3 storms before 8/20), rather than having a smaller peak in June-July like the last several seasons.


I don't think the set-up for this year is that unfavorable. Seasonal forecasters are generally in the slightly to moderately above average camp, which seems reasonable given the cool neutral enso and marginally above normal tropical Atlantic. I think 2022 is a much more realistic floor than 2015 given that year had super el nino which nearly always yields a well below average season for the Atlantic.
3 likes   

User avatar
aspen
Category 5
Category 5
Posts: 8818
Joined: Sat Oct 12, 2019 7:10 pm
Location: Connecticut, USA

Re: 2025 Indicators: SST's, MSLP, Shear, SAL, Steering, Instability (Day 16+ Climate Models)

#303 Postby aspen » Wed Jun 18, 2025 10:41 am

WeatherBoy2000 wrote:
aspen wrote:
LarryWx wrote:The latest Euro Weeklies, which go through July 13th, have mainly quiet in the Atlantic basin and near normal ACE in the E and W Pacific. If there are no TCs by July 13th, this would mean the quietest start in the Atlantic since 2009! Other years with no NS through July 13th since 1995 were 1998, 2000, 2002, and 2004.

I really wish I could say otherwise (I’d love to finally see a weak season), but I still expect an above normal season. The Atlantic tropics, though not nearly as warm as 2023-4, are still plenty warm enough and expected to continue that way. Also, we’re looking at a ~weak La Niña during ASO per RONI. That combo typically correlates to active seasons including for the corridor from the NE Caribbean through Bahamas, FL, SE US, and E Gulf though I’m still hoping it won’t be nearly as bad there as the terrible 2024, which is suggested by the last two monthly Euro seasonal outlooks.

Interestingly, more than half of the seasons in the last 30 years without a TS before July 13th (1998, 2000, and 2004) were at least somewhat above-average. So that by itself doesn’t mean we’ll get another 2002 or 2009-esqe year, but looking at the mixed to slightly unfavorable long-term environmental forecasts, I think we could be in for the least active season since 2015.

We’re probably not going to see much early development this year as opposed to 2020-24, with all of the Central American disturbances forming in the EPac and sinking patterns forecast later in June into July. Perhaps we’ll see something like 2019 where it takes until late August for activity to full ramp up (no more than 3 storms before 8/20), rather than having a smaller peak in June-July like the last several seasons.


I don't think the set-up for this year is that unfavorable. Seasonal forecasters are generally in the slightly to moderately above average camp, which seems reasonable given the cool neutral enso and marginally above normal tropical Atlantic. I think 2022 is a much more realistic floor than 2015 given that year had super el nino which nearly always yields a well below average season for the Atlantic.

I was thinking of 2022 too when I saw comments and forecasts about a warmer-than-normal northern Atlantic. The anomalously high +SSTAs in the NW Atlantic off the US east coast from July-August 2022 helped impart a lot of stability and wave breaking until early-mid September. Maybe we could see something similar this year.

I just used 2015 as a comparison for how the final seasonal numbers could end up (<14 NS and <100 ACE), rather than a comparison of seasonal indicators. If 2025 ends up close to 2015’s numbers, it won’t be for any of the same reasons.
1 likes   
Irene '11 Sandy '12 Hermine '16 5/15/2018 Derecho Fay '20 Isaias '20 Elsa '21 Henri '21 Ida '21

I am only a meteorology enthusiast who knows a decent amount about tropical cyclones. Look to the professional mets, the NHC, or your local weather office for the best information.

LarryWx
S2K Supporter
S2K Supporter
Posts: 6294
Joined: Sun Sep 07, 2003 2:04 pm
Location: GA

Re: 2025 Indicators: SST's, MSLP, Shear, SAL, Steering, Instability (Day 16+ Climate Models)

#304 Postby LarryWx » Wed Jun 18, 2025 11:58 am

aspen wrote:
LarryWx wrote:The latest Euro Weeklies, which go through July 13th, have mainly quiet in the Atlantic basin and near normal ACE in the E and W Pacific. If there are no TCs by July 13th, this would mean the quietest start in the Atlantic since 2009! Other years with no NS through July 13th since 1995 were 1998, 2000, 2002, and 2004.

I really wish I could say otherwise (I’d love to finally see a weak season), but I still expect an above normal season. The Atlantic tropics, though not nearly as warm as 2023-4, are still plenty warm enough and expected to continue that way. Also, we’re looking at a ~weak La Niña during ASO per RONI. That combo typically correlates to active seasons including for the corridor from the NE Caribbean through Bahamas, FL, SE US, and E Gulf though I’m still hoping it won’t be nearly as bad there as the terrible 2024, which is suggested by the last two monthly Euro seasonal outlooks.

Interestingly, more than half of the seasons in the last 30 years without a TS before July 13th (1998, 2000, and 2004) were at least somewhat above-average. So that by itself doesn’t mean we’ll get another 2002 or 2009-esqe year, but looking at the mixed to slightly unfavorable long-term environmental forecasts, I think we could be in for the least active season since 2015.

We’re probably not going to see much early development this year as opposed to 2020-24, with all of the Central American disturbances forming in the EPac and sinking patterns forecast later in June into July. Perhaps we’ll see something like 2019 where it takes until late August for activity to full ramp up (no more than 3 storms before 8/20), rather than having a smaller peak in June-July like the last several seasons.


The big thing going against a 2002 or 2009 type year (only 3-4 Hs) is that they were during El Niño vs 2025’s expected La Niña (at least on RONI basis).
3 likes   
Personal Forecast Disclaimer:
The posts in this forum are NOT official forecasts and should not be used as such. They are just the opinion of the poster and may or may not be backed by sound meteorological data. They are NOT endorsed by any professional institution or storm2k.org. For official information, please refer to the NHC and NWS products.

USTropics
Professional-Met
Professional-Met
Posts: 2646
Joined: Sun Aug 12, 2007 3:45 am
Location: Florida State University

Re: 2025 Indicators: SST's, MSLP, Shear, SAL, Steering, Instability (Day 16+ Climate Models)

#305 Postby USTropics » Wed Jun 18, 2025 12:39 pm

chaser1 wrote:
WeatherBoy2000 wrote:
TomballEd wrote:A few have alluded to it but CFS Monthly, CanSIPS and NMME all show the greatest temperature anomalies in a generally warmer than normal Atlantic is N of the tropics. Might favor some sub or subtropical to fully tropical systems outside the MDR, especially later in the season. But longer track storms in the tropics are not favored.

Whether that means below normal MDR development or later developing (less chance of missing land) systems developing in the Caribbean or Gulf, that is the question.


The set-up predicted is very reminiscent of 2021 which had a pretty decent mdr showing with notable long trackers like Larry/Sam. The Atlantic nino typically pushes the ITCZ further south, so theoretically it could somewhat combat any stability/dry air issues.


The ITCZ remaining suppressed further south as we approach peak season would be rather interesting for a couple of reasons. Firstly, it would be suggestive of higher surface pressures out there and east of the Antilles. That alone could suppress activity and mitigate tropical cyclones from easily organizing. Even more interesting is a statement that I recall CSU (I believe it was CSU?) within their initial season forecast discussion, suggesting the contrary. Something along the lines that they were anticipating the large W. African Monsoon trough to extend further west and north (as it had last year) thus resulting in tropical waves to exit the African coast further north and potentially resulting in several far east Atlantic storms to form and quickly recurve poleward (depending on SST's of course). That would certainly be a very different look then what we currently have in place. Then again, we're in middle June - a way's to go before "prime-time". It'll be interesting to see if that pattern verifies.


I'm not seeing anything currently to suggest the ITCZ will be significantly suppressed to the south this year, at least not a latitudinal suppression. You can get historic TAFB surface analysis products (https://ftp.nhc.ncep.noaa.gov/tafb/surface_analysis/) going back to 1998. I looped together the June 17th 18z analysis since 2020:
Image

The western branch of the ITF is also nominal:
Image
Image

What I am more interested in is the eastern branch of the ITF position this year as we head towards August. There was a significant jump last year in latitude in June, which likely attributed to Beryl (and also a more subdued July/August afterwards):
Image

We'll see how June progresses, but currently not seeing that as being a negative this year:
Image

What I am seeing as a negative (and why the convective suppression of the ITCZ in July is being forecast by the ECMWF and other models) is the 500mb heights for July. Here is the CFS (the CANSIPS and other models are similar):
Image

When we get troughing off the NW coast of Africa near Portugal/Spain and this undercutting ridge extension across the Atlantic, this leads to subdued zonal flow of the ITCZ (and also indicates to me we will have some SAL outbreaks).
Image

We already had a significant SAL outbreak in May, and this is one of the climatological peaks (end of June into beginning of August) for such events:
Image

https://www.nesdis.noaa.gov/news/noaas-satellites-track-saharan-dust-blowing-across-the-atlantic

So all in all, this season is behaving like a normal season so far. Expected ACE to date is 1.7. I would expect a subdued June/July, but like the EPAC is showing this past week, there will be favorable windows when the climatological peak nears:
Image

Image

Image
11 likes   

User avatar
weeniepatrol
Category 5
Category 5
Posts: 1273
Joined: Sat Aug 22, 2020 5:30 pm
Location: WA State

Re: 2025 Indicators: SST's, MSLP, Shear, SAL, Steering, Instability (Day 16+ Climate Models)

#306 Postby weeniepatrol » Wed Jun 18, 2025 2:44 pm

Be wary of comparisons to seasons like 2002, 2006, 2009, or 2015. Those are Nino years. Which this one is not. EPAC activity is being forced by higher-frequency intraseasonal forcing (atmospheric Kelvin waves). Not ENSO
3 likes   

Sciencerocks
Category 5
Category 5
Posts: 9152
Age: 39
Joined: Thu Jul 06, 2017 1:51 am

Re: 2025 Indicators: SST's, MSLP, Shear, SAL, Steering, Instability (Day 16+ Climate Models)

#307 Postby Sciencerocks » Wed Jun 18, 2025 7:59 pm

I will say one thing and that is if the eastern pacific continues with this activity then the focus of the energy will be in that basin for the first couple of months at a minimum and that will rob a lot of the energy from the Atlantic. The CAG will focus its early season energy in that basin. The sst pattern reminds me of seasons that produce closer to 14-16 for the Atlantic. So not super active capably to the super active decade that we've had so far...20+ storms. In the 1990's or early 2000's the hurricane tracking community more or less thought that such was extremely rare and a one off year.

2011 is one year I put as a analog in my seasonal thinking as the sst pattern reminds me of a season that either produces storms that head just off shore of the eastern united states or impact like 1944, 1958, and 2011.

May take another month or even to August before it can take control of the bit of the energy caused by higher easterly trades and a stronger azores high forcing the energy further westward before it can develop into cyclones. This azores high is causing the upwelling at 20-25 north from 30-60 west. https://www.ospo.noaa.gov/products/ocean/sst/anomaly/ I'd watch western Atlantic and subtropics but we'll certainly have a few in the mdr storms as the sst's below 20 within that zone is certainly high enough to support such. Irene? Floyd, Earl, Helene

1. Western Atlantic(possibly even the subtropics!)
2. MDR cape verde systems once they get going and you really have to watch this for a 1944, Helene 58, Gloria 85, or Irene 2011 type storm, Floyd,
1 likes   

User avatar
Kingarabian
S2K Supporter
S2K Supporter
Posts: 15979
Joined: Sat Aug 08, 2009 3:06 am
Location: Honolulu, Hawaii

Re: 2025 Indicators: SST's, MSLP, Shear, SAL, Steering, Instability (Day 16+ Climate Models)

#308 Postby Kingarabian » Thu Jun 19, 2025 10:35 am

weeniepatrol wrote:Be wary of comparisons to seasons like 2002, 2006, 2009, or 2015. Those are Nino years. Which this one is not. EPAC activity is being forced by higher-frequency intraseasonal forcing (atmospheric Kelvin waves). Not ENSO
Those CCKWs have been so persistent that I would now call it an abnormal rising air branch/standing wave situated in the far eastern Pacific.
0 likes   
RIP Kobe Bryant

WeatherBoy2000
Category 1
Category 1
Posts: 344
Joined: Mon Apr 10, 2023 9:29 am

Re: 2025 Indicators: SST's, MSLP, Shear, SAL, Steering, Instability (Day 16+ Climate Models)

#309 Postby WeatherBoy2000 » Thu Jun 19, 2025 12:24 pm

Kingarabian wrote:
weeniepatrol wrote:Be wary of comparisons to seasons like 2002, 2006, 2009, or 2015. Those are Nino years. Which this one is not. EPAC activity is being forced by higher-frequency intraseasonal forcing (atmospheric Kelvin waves). Not ENSO
Those CCKWs have been so persistent that I would now call it an abnormal rising air branch/standing wave situated in the far eastern Pacific.


The anomalous activity in the epac is probably being aided by the ever re-emerging warm ssts in the nino 1+2 region:

 https://x.com/PaulRoundy1/status/1935705028552994971

0 likes   

User avatar
Kingarabian
S2K Supporter
S2K Supporter
Posts: 15979
Joined: Sat Aug 08, 2009 3:06 am
Location: Honolulu, Hawaii

Re: 2025 Indicators: SST's, MSLP, Shear, SAL, Steering, Instability (Day 16+ Climate Models)

#310 Postby Kingarabian » Thu Jun 19, 2025 2:18 pm

WeatherBoy2000 wrote:
Kingarabian wrote:
weeniepatrol wrote:Be wary of comparisons to seasons like 2002, 2006, 2009, or 2015. Those are Nino years. Which this one is not. EPAC activity is being forced by higher-frequency intraseasonal forcing (atmospheric Kelvin waves). Not ENSO
Those CCKWs have been so persistent that I would now call it an abnormal rising air branch/standing wave situated in the far eastern Pacific.


The anomalous activity in the epac is probably being aided by the ever re-emerging warm ssts in the nino 1+2 region:

 https://x.com/PaulRoundy1/status/1935705028552994971


Yeah there is something going on in the far eastern Pacific that is also tied to Niño 1+2 to reward consistently.
0 likes   
RIP Kobe Bryant

User avatar
weeniepatrol
Category 5
Category 5
Posts: 1273
Joined: Sat Aug 22, 2020 5:30 pm
Location: WA State

Re: 2025 Indicators: SST's, MSLP, Shear, SAL, Steering, Instability (Day 16+ Climate Models)

#311 Postby weeniepatrol » Thu Jun 19, 2025 2:47 pm

Kingarabian wrote:
weeniepatrol wrote:Be wary of comparisons to seasons like 2002, 2006, 2009, or 2015. Those are Nino years. Which this one is not. EPAC activity is being forced by higher-frequency intraseasonal forcing (atmospheric Kelvin waves). Not ENSO
Those CCKWs have been so persistent that I would now call it an abnormal rising air branch/standing wave situated in the far eastern Pacific.


This extent of intraseasonal forcing does make it appear very similar to enso in terms of some effects, such as overall TC activity thus far. But make no mistake, many components of the walker circulation are currently antithetical to El Niño.

Image
0 likes   

mixedDanilo.E
Tropical Depression
Tropical Depression
Posts: 86
Joined: Sun Nov 21, 2021 8:00 am
Location: NY

Re: 2025 Indicators: SST's, MSLP, Shear, SAL, Steering, Instability (Day 16+ Climate Models)

#312 Postby mixedDanilo.E » Thu Jun 19, 2025 3:23 pm

Image

I think any sort of warming that we are may see now along the EQ will probably go a way - there is a CCKW moving through which you can see by some of the westerlies short term in the pacific but longer term as we head into July, it seems like general persistent trades return. So I think over the next few weeks the EPac will eventually quiet down and maybe that'll open the door for the Atlantic to have a window of opportunity.
0 likes   

User avatar
Kingarabian
S2K Supporter
S2K Supporter
Posts: 15979
Joined: Sat Aug 08, 2009 3:06 am
Location: Honolulu, Hawaii

Re: 2025 Indicators: SST's, MSLP, Shear, SAL, Steering, Instability (Day 16+ Climate Models)

#313 Postby Kingarabian » Thu Jun 19, 2025 7:39 pm

weeniepatrol wrote:
Kingarabian wrote:
weeniepatrol wrote:Be wary of comparisons to seasons like 2002, 2006, 2009, or 2015. Those are Nino years. Which this one is not. EPAC activity is being forced by higher-frequency intraseasonal forcing (atmospheric Kelvin waves). Not ENSO
Those CCKWs have been so persistent that I would now call it an abnormal rising air branch/standing wave situated in the far eastern Pacific.


This extent of intraseasonal forcing does make it appear very similar to enso in terms of some effects, such as overall TC activity thus far. But make no mistake, many components of the walker circulation are currently antithetical to El Niño.

https://i.imgur.com/pT03pHa.gif

Completely agree. Whatever is going on in the Eastern EPAC has nothing to do with ENSO mechanism. But it might be the same force that causes the coastal Nino via Nino 1+2 as observed during this past spring and in 2012 etc. Might be connected to this burst of EPAC TC activity.
2 likes   
RIP Kobe Bryant

User avatar
DorkyMcDorkface
Category 3
Category 3
Posts: 887
Age: 27
Joined: Mon Sep 30, 2019 1:32 pm
Location: Mid-Atlantic

Re: 2025 Indicators: SST's, MSLP, Shear, SAL, Steering, Instability (Day 16+ Climate Models)

#314 Postby DorkyMcDorkface » Thu Jun 19, 2025 8:51 pm

There's a good chance the EPAC will finally slow down with this look which should theoretically open up a window for the Atlantic, but at the same time it's not exactly the most favorable setup.
 https://x.com/dmorris9661/status/1935812268685455438

0 likes   

Please note the thougths expressed by this account are solely those of the user and are from a hobbyist perspective. For more comprehensive analysis, consult an actual professional meteorologist or meteorology agency.


Floyd 1999 | Isabel 2003 | Hanna 2008 | Irene 2011 | Sandy 2012 | Isaias 2020

User avatar
Category5Kaiju
Category 5
Category 5
Posts: 4094
Joined: Thu Dec 24, 2020 12:45 pm
Location: Seattle

Re: 2025 Indicators: SST's, MSLP, Shear, SAL, Steering, Instability (Day 16+ Climate Models)

#315 Postby Category5Kaiju » Thu Jun 19, 2025 9:23 pm

DorkyMcDorkface wrote:There's a good chance the EPAC will finally slow down with this look which should theoretically open up a window for the Atlantic, but at the same time it's not exactly the most favorable setup.
 https://x.com/dmorris9661/status/1935812268685455438


I think between that and the current sst anomaly configuration (let alone elevated shear, active EPAC, SAL, etc.), we're probably looking at one of the most unfavorable June/July periods in recent memory. It actually would be interesting to see what those factors looked like during years like 1980, 1998, or 2004, seasons which also a completely dead June and July (er, at least the vast majority of July). Interestingly, those three seasons ended up as borderline hyperactive or bona fide hyperactive years.

Based on the velocity map, however, I can see a scenario in which we get more moisture and waves coming off of Africa in July. Whether they struggle with shear, dry up, etc. remains to be seen, though I probably wouldn't bet on them really amounting to anything significant. The large sinking area over the Atlantic probably would mean that homegrown systems are less likely to occur. We could get some weak system in the subtropics, but that's not a guarantee.

In all, I'm not really expecting anything huge in the near future. August will be the critical month to watch, and it will be very interesting to see how things look by the time that rolls around.
2 likes   
Unless explicitly stated, all info in my posts is based on my own opinions and observations. Tropical storms and hurricanes can be extremely dangerous. Do not think you can beat Mother Nature. Refer to an accredited weather research agency or meteorologist if you need to make serious decisions regarding an approaching storm.

TomballEd
Category 2
Category 2
Posts: 683
Age: 61
Joined: Wed Aug 16, 2023 4:52 pm
Location: Spring/Klein area, not Tomball

Re: 2025 Indicators: SST's, MSLP, Shear, SAL, Steering, Instability (Day 16+ Climate Models)

#316 Postby TomballEd » Fri Jun 20, 2025 12:12 am

I just get a slow season vibe, although what does develop developing further W, if it happens, could still mean an eventful season for the Caribbean and North America.

 https://x.com/AndyHazelton/status/1935850309877920156

0 likes   

User avatar
Teban54
Category 5
Category 5
Posts: 3204
Joined: Sat May 19, 2018 1:19 pm

Re: 2025 Indicators: SST's, MSLP, Shear, SAL, Steering, Instability (Day 16+ Climate Models)

#317 Postby Teban54 » Fri Jun 20, 2025 7:01 am

TomballEd wrote:I just get a slow season vibe, although what does develop developing further W, if it happens, could still mean an eventful season for the Caribbean and North America.

 https://x.com/AndyHazelton/status/1935850309877920156


The OISST data (as Andy tweeted) actually looks somewhat different with Coral Reef Watch when it comes to the "southern MDR" near 10N:

Image

Image
0 likes   

tolakram
Admin
Admin
Posts: 20009
Age: 62
Joined: Sun Aug 27, 2006 8:23 pm
Location: Florence, KY (name is Mark)

Re: 2025 Indicators: SST's, MSLP, Shear, SAL, Steering, Instability (Day 16+ Climate Models)

#318 Postby tolakram » Fri Jun 20, 2025 7:02 am

We're always fighting last season. Everything looks like a normal season to me, including right now. EPAC active on time, unlike last year, Atlantic will follow in late July or August.
6 likes   
M a r k
- - - - -
Join us in chat: Storm2K Chatroom Invite. Android and IOS apps also available.

The posts in this forum are NOT official forecasts and should not be used as such. Posts are NOT endorsed by any professional institution or STORM2K.org. For official information and forecasts, please refer to NHC and NWS products.

WeatherBoy2000
Category 1
Category 1
Posts: 344
Joined: Mon Apr 10, 2023 9:29 am

Re: 2025 Indicators: SST's, MSLP, Shear, SAL, Steering, Instability (Day 16+ Climate Models)

#319 Postby WeatherBoy2000 » Fri Jun 20, 2025 7:29 am

Teban54 wrote:
TomballEd wrote:I just get a slow season vibe, although what does develop developing further W, if it happens, could still mean an eventful season for the Caribbean and North America.

 https://x.com/AndyHazelton/status/1935850309877920156


The OISST data (as Andy tweeted) actually looks somewhat different with Coral Reef Watch when it comes to the "southern MDR" near 10N:

https://i.postimg.cc/6q8GppQn/image.png

https://i.postimg.cc/zXRgmv61/image.png


Don't know what's up with the discrepancy between the two. The Coral Reef watch still shows a slightly above normal mdr while the OISST has had the mdr tank below normal in the past couple days:

Image

Image
0 likes   

USTropics
Professional-Met
Professional-Met
Posts: 2646
Joined: Sun Aug 12, 2007 3:45 am
Location: Florida State University

Re: 2025 Indicators: SST's, MSLP, Shear, SAL, Steering, Instability (Day 16+ Climate Models)

#320 Postby USTropics » Fri Jun 20, 2025 10:09 am

WeatherBoy2000 wrote:
Teban54 wrote:
TomballEd wrote:I just get a slow season vibe, although what does develop developing further W, if it happens, could still mean an eventful season for the Caribbean and North America.

 https://x.com/AndyHazelton/status/1935850309877920156


The OISST data (as Andy tweeted) actually looks somewhat different with Coral Reef Watch when it comes to the "southern MDR" near 10N:

https://i.postimg.cc/6q8GppQn/image.png

https://i.postimg.cc/zXRgmv61/image.png


Don't know what's up with the discrepancy between the two. The Coral Reef watch still shows a slightly above normal mdr while the OISST has had the mdr tank below normal in the past couple days:

https://cyclonicwx.com/data/sst/crw_ssta_graph_atlmdr.png

https://cyclonicwx.com/data/sst/oisst_ssta_graph_atlmdr.png


This is something I looked into a few years ago, and there are primarily three factors in the differences: (1) variability in data input, (2) gridded resolution, and (3) interpolation used to determine missing gridded values/correction algorithms to biases.
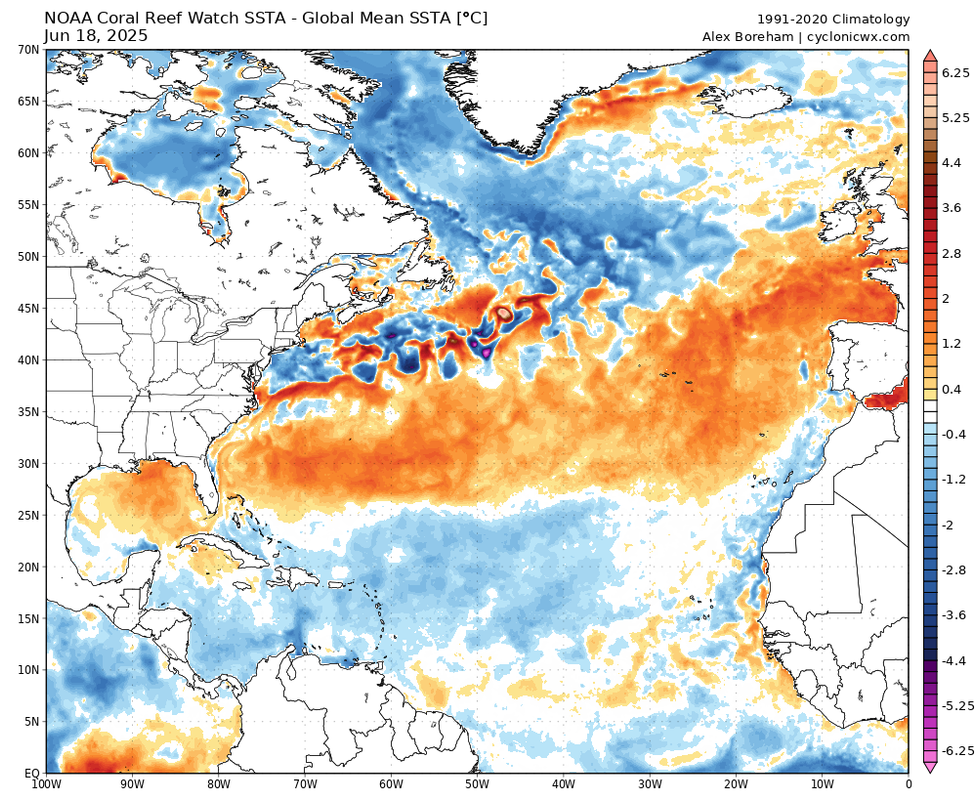
Coral Reef Watch (CRW)
Data input - This is derived using primarily SST data from thermal infrared sensors on nine polar-orbiting satellites (also known as the real-time Geo-Polar Blended SST) and all of the in situ data contained within the the International Comprehensive Ocean-Atmosphere Data Set (ICOADS).

Resolution - The CRW product has a 5km resolution (0.05 degree spatial resolution).

Processing/algorithms - Gaps are filled using optimal interpolation, with bias corrections based on the OSTIA (Operational Sea Surface Temperature and Sea Ice Analysis) dataset.

This is also only a nighttime product, from NOAA's methodology section:

The CoralTemp SST provides a measurement of the nighttime ocean temperature at the sea surface, calibrated to 0.2 meters depth. Nighttime-only satellite SST observations are used to reduce the influence of daytime warming caused by solar heating at and near the sea surface and to avoid contamination from solar glare. Furthermore, at night, water temperatures at and near the sea surface are more vertically uniform.

https://coralreefwatch.noaa.gov/product/5km/methodology.php#sst


Optimum Interpolation Sea Surface Temperature (OISST)
Data input - 
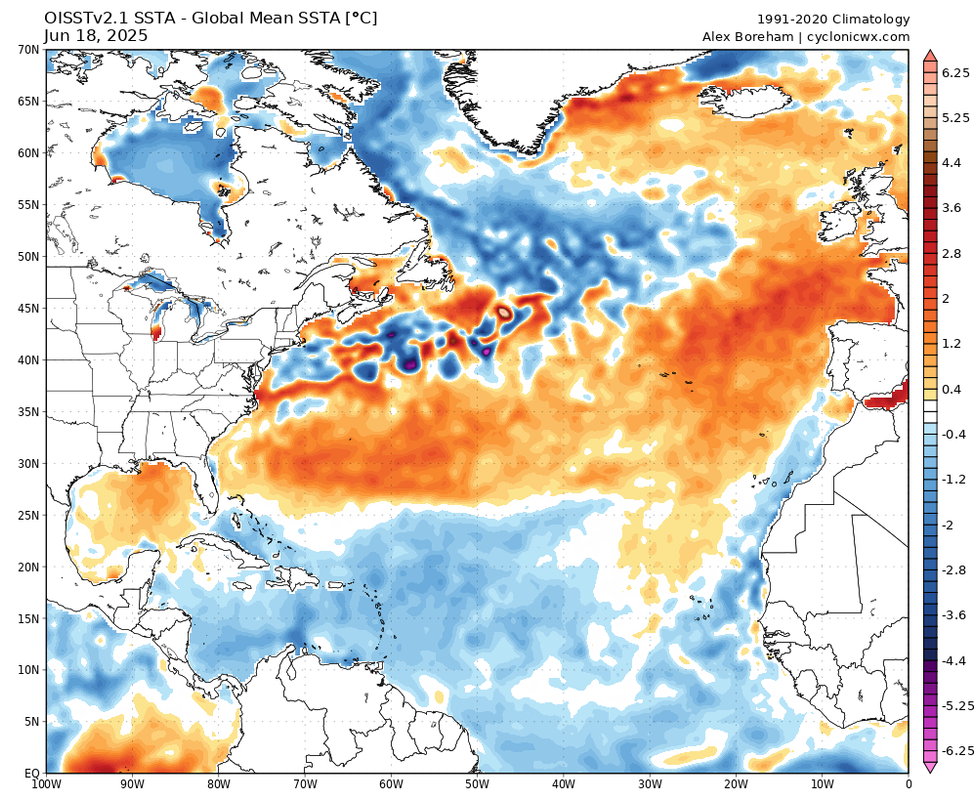
OISST employs optimal interpolation to combine satellite data (primarily AVHRR), in situ measurements (ships, buoys, Argo floats), and proxy SSTs from sea ice concentrations. Essentially, it uses a more comprehensive range of data sources.

Resolution - OISST uses a much coarser resolution at 25km (0.25 degree spatial resolution).

Processing/algorithms - OISST incorporates both daytime and nighttime observations, which can introduce differences due to diurnal warming effects. It uses a broader range of data sources and applies bias corrections relative to buoy data, with monthly adjustments to ship and satellite data.

Image

TL;DR
OISST’s inclusion of in situ data and broader interpolation techniques may smooth out anomalies over larger areas, while CRW’s higher-resolution, satellite-focused approach captures finer-scale variations. CRW focuses heavily on resolution since the product was designed to examine abrupt SST departures/thermal stresses and coral reef monitoring. OISST is considered a more general-purpose climate data product; its coarser resolution and broader data integration prioritize global consistency over localized precision (like ENSO monitoring).

Official documentation
CRW - https://coastwatch.noaa.gov/cwn/products/noaa-geo-polar-blended-global-sea-surface-temperature-analysis-level-4.html
OISST - https://www.ncei.noaa.gov/products/optimum-interpolation-sst
8 likes   


Return to “Talkin' Tropics”

Who is online

Users browsing this forum: Cdenton12, cycloneye, Stormybajan, Ulf and 11 guests