Erin is looking better this morning, with improved convective banding in the past few hours. I'll go through what I've seen on satellite imagery this morning and what was corroborated by the two recon flight missions. We're likely to see a few more 'pulse up' phases where the circulation and wind field increases in diameter, and a bit of reconfiguration is required. I'll outline this process from my morning analysis below.
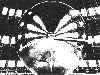
This was the first visible satellite imagery from this morning (~6AM eastern time), and I've outlined what I'm seeing from the cloud features. Erin is finally able to really build up her moisture profile with increasing SSTs and decreasing shear values, and this is most evident by the ability to produce a convective inflow canopy out in front of the main circulation (teal/blue). This is allowing for some mixing of the dry air/subsidence before the air mass enters the inflow channels of Erin. There was still an evident dry slot and dry air mass to the east of Erin (orange), and evidence of two vertical hot towers (VHTs, green) which was the catalyst for producing an initial pinhole eyewall that recon found early this morning:

This was confirmed by recon and can be analyzed in CIMSS products:

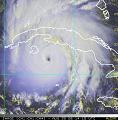
Moving forward an hour 1/2 later, we can clearly see the signs of an eyewall formation in its beginning stages (teal, pinhole formation is gone), and it appears the dry air slot is eroding the southwest periphery (dashed red):

Move forward another hour, and our eyewall has rotated, so that the open slot is now located to the northwest (confirmed by recon at this time). The eyewall structure is starting to become more circular, and there are further signs that Erin is able to properly fight off the dry air intrusions this go around. While dry air generally inhibits widespread hurricane development by suppressing convection and capping its vertical depth, it can paradoxically contribute to the formation of vertical hot towers. I have circled these in green, and specifically we are looking in the cloud decks of the inflow bands:

This is a bit more technical, but if you want to understand what exactly is going on here, I'll break it down further:
- Dry air/SAL enters the hurricane's circulation typically at the mid-levels (700mb).
- Upon intrusion, the dry air mixes with the storm's moist air, leading to evaporation of raindrops and cloud droplets. This evaporation is a cooling process (evaporative cooling), which lowers temperatures in the mid-to-lower troposphere.
- The mid-level cooling from dry air intrusion steepens the vertical temperature lapse rate (the rate at which temperature decreases with height).
- This increases convective instability, as the cooler mid-level air overlays warmer, moist air near the surface, making the atmosphere more prone to vigorous updrafts where sufficient moisture converges.
- In the rainbands, low-level moist air (drawn in by the storm's inflow) encounters this heightened instability.
- The contrast between the dry mid-levels and moist low-levels amplifies conditional instability, allowing parcels of air to rise more rapidly and with greater buoyancy once lifted.
Here is the full animation of visible imagery:

You can really see these cool VHT processes with the dry air using mesoscale imagery and speeding it up:

Expect more of these pulse up and reconfiguration episodes of the inner core as Erin progresses today.


